
A day doesn’t seem to go by without a market pundit asserting that Japan is in a monetary and fiscal death spiral. It’s easy to come to such a conclusion given:
- Debt to GDP: 230%.
- Bank of Japan (BOJ): Holds over 50% Japanese Treasury debt.
- Population: Shrinking by 0.5% a year.
- GDP Stagnation: Real GDP has grown by less than 0.5% annualized since 2008.
- Debt Servicing: Nearly 25% of Japan’s fiscal budget is spent on servicing its debt.
- Yen: Its currency has fallen by over 50% against the US dollar since 2012, as shown below.
Based on those stats and others, it’s easy to see why many think it’s only a matter of time before Japan’s economic system collapses. Michael Nicoletos, in Japan Isn’t Losing Control, argues otherwise. In fact, he thinks everything is going according to plan. To wit, he deems the BOJ as “the most experienced unconventional monetary operator on the planet.” With the Bank of Japan owning about half of all Japanese government bonds and domestic holders a large majority of the remaining debt, Japan effectively is its own bond market. This allows the BOJ to let long‑term yields rise and engineer a weaker yen, which boosts exporters’ profits. To wit:
When Toyota’s finance team crunches the numbers, they estimate they gain about $300 million in profit for every single yen the currency weakens against the dollar.
Michael believes Japan and China are in a “diplomatic crisis.” Given that their second-largest trade customer is China, Japan needs to diversify. A weaker yen allows such to occur. He states:
Japanese goods are becoming cheaper relative to Chinese alternatives, not just for American buyers, but also for customers throughout Southeast Asia, Europe, and Latin America. Just as political tensions make relying on China riskier, Japan becomes a more attractive alternative supplier.
Overall, Michael claims that “the yen is not crashing because Japan lost control” but because “Japan wants it to.” Furthermore, this is a major but “underappreciated” story in global finance.
(Click on image to enlarge)

What To Watch Today
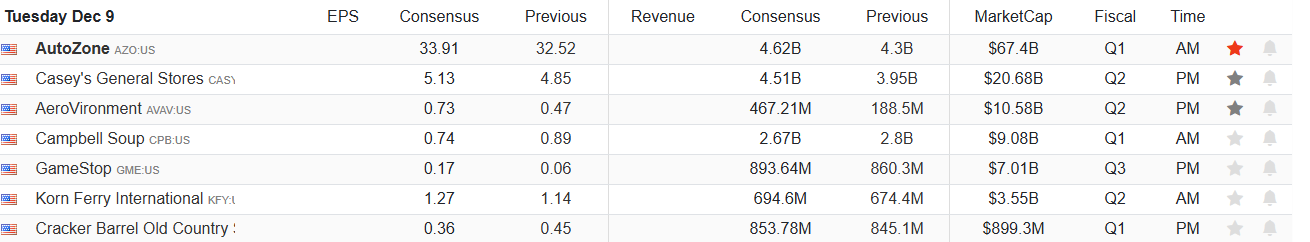
Earnings
(Click on image to enlarge)
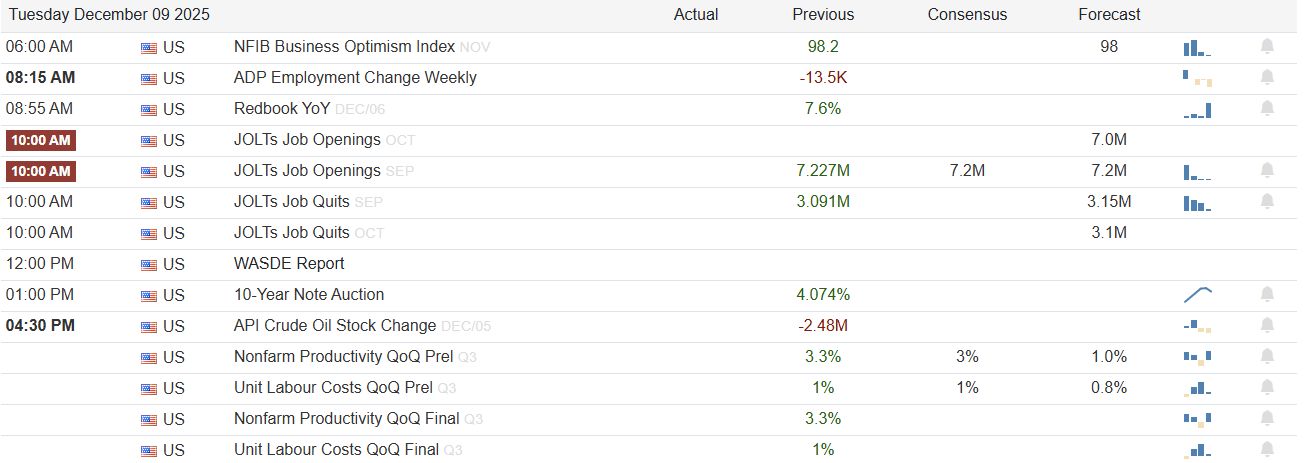
Economy
(Click on image to enlarge)
Market Trading Update
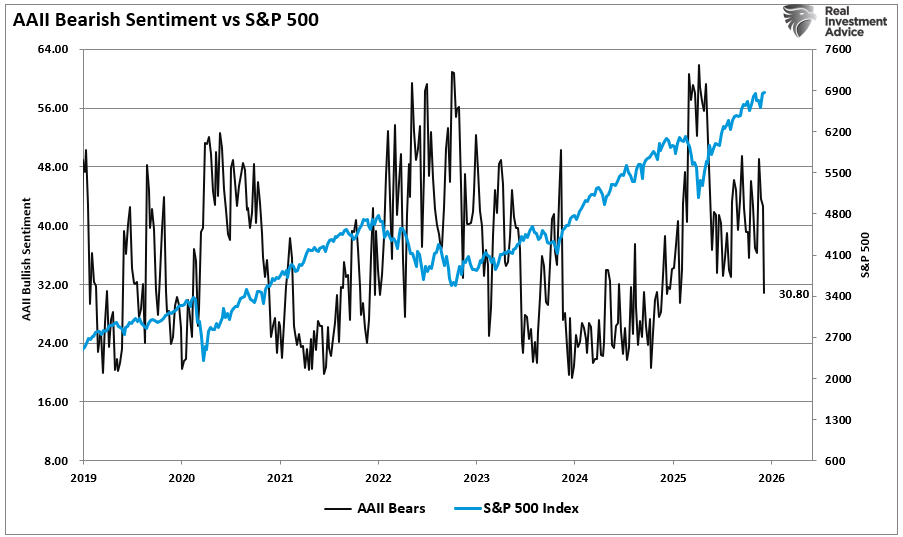
Yesterday, we discussed the technical backdrop to the market. As we noted, the backdrop remains technically supportive of a year-end rally. Notably, bullish sentiment has already increased sharply following the drop seen in early November. As shown, we just had one of the most significant drops in bearish sentiment since last April.
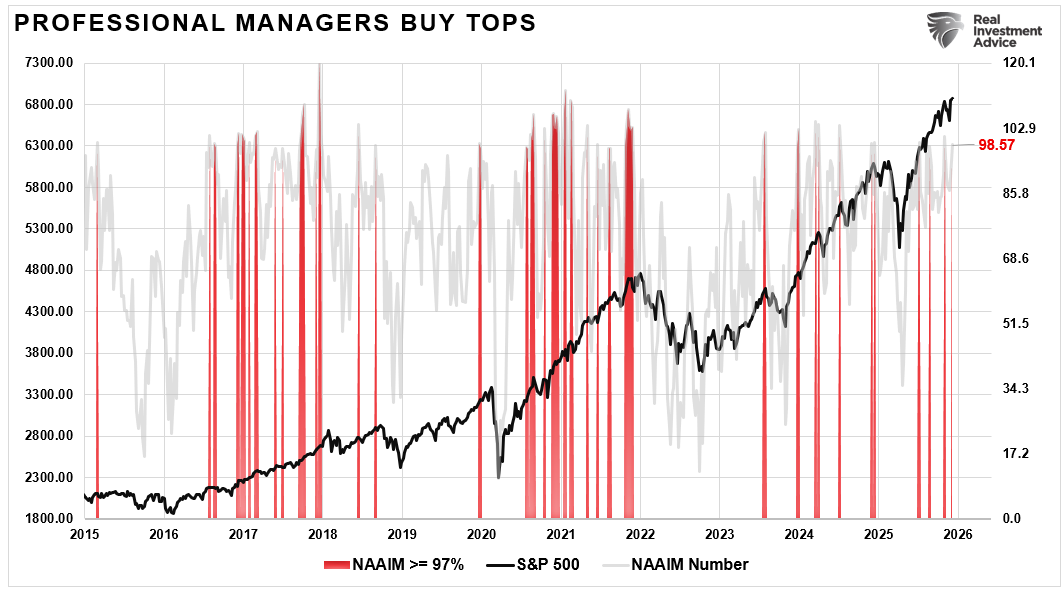
At the same time, we observed a very aggressive push by professional investors to increase their equity exposure. As shown, the NAAIM index surged from 89 to 98 last week alone. While such surges are not unusual, they do suggest that the return of bullish “risk taking” will be supportive of markets in the near term.
We also observe a similar sharp increase in global investor positioning over the past week.
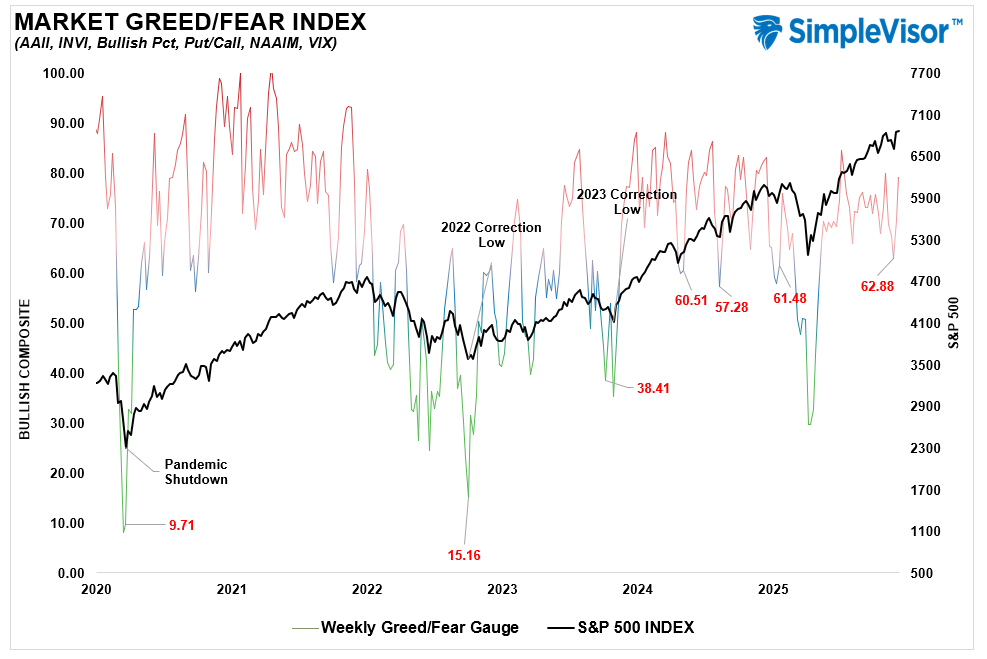
What this all suggests is that risk-taking is back in vogue heading into year-end and should continue to support further gains between now and the New Year. Add to that that a more dovish Fed narrative is driving the shift. Inflation prints are easing, and labor markets are cooling, but not breaking. This is fueling the rotation into risk assets, with breadth improving across sectors.
As such, it is essential to begin positioning portfolios for what has statistically been a stronger year-end finish.
- Increase exposure to large-cap growth by focusing on companies with solid earnings and strong free cash flow. Tech and communications are leading this leg higher.
- Add cyclical sectors with improving momentum: Industrials and financials are gaining momentum. These reflect optimism about soft landing expectations.
- Trim cash and redeploy into high-quality equities: Cash was a good option in November, but now it’s time to rebalance slowly on weakness.
- Tax loss sell losing positions that can be repurchased in January.
- Tighten stop losses and review trailing gains: Volatility can return quickly, so lock in gains methodically and stay nimble. Use your tax loss sales to offset the taxes.
Trade accordingly.
Breadth Is Good, But Confusing
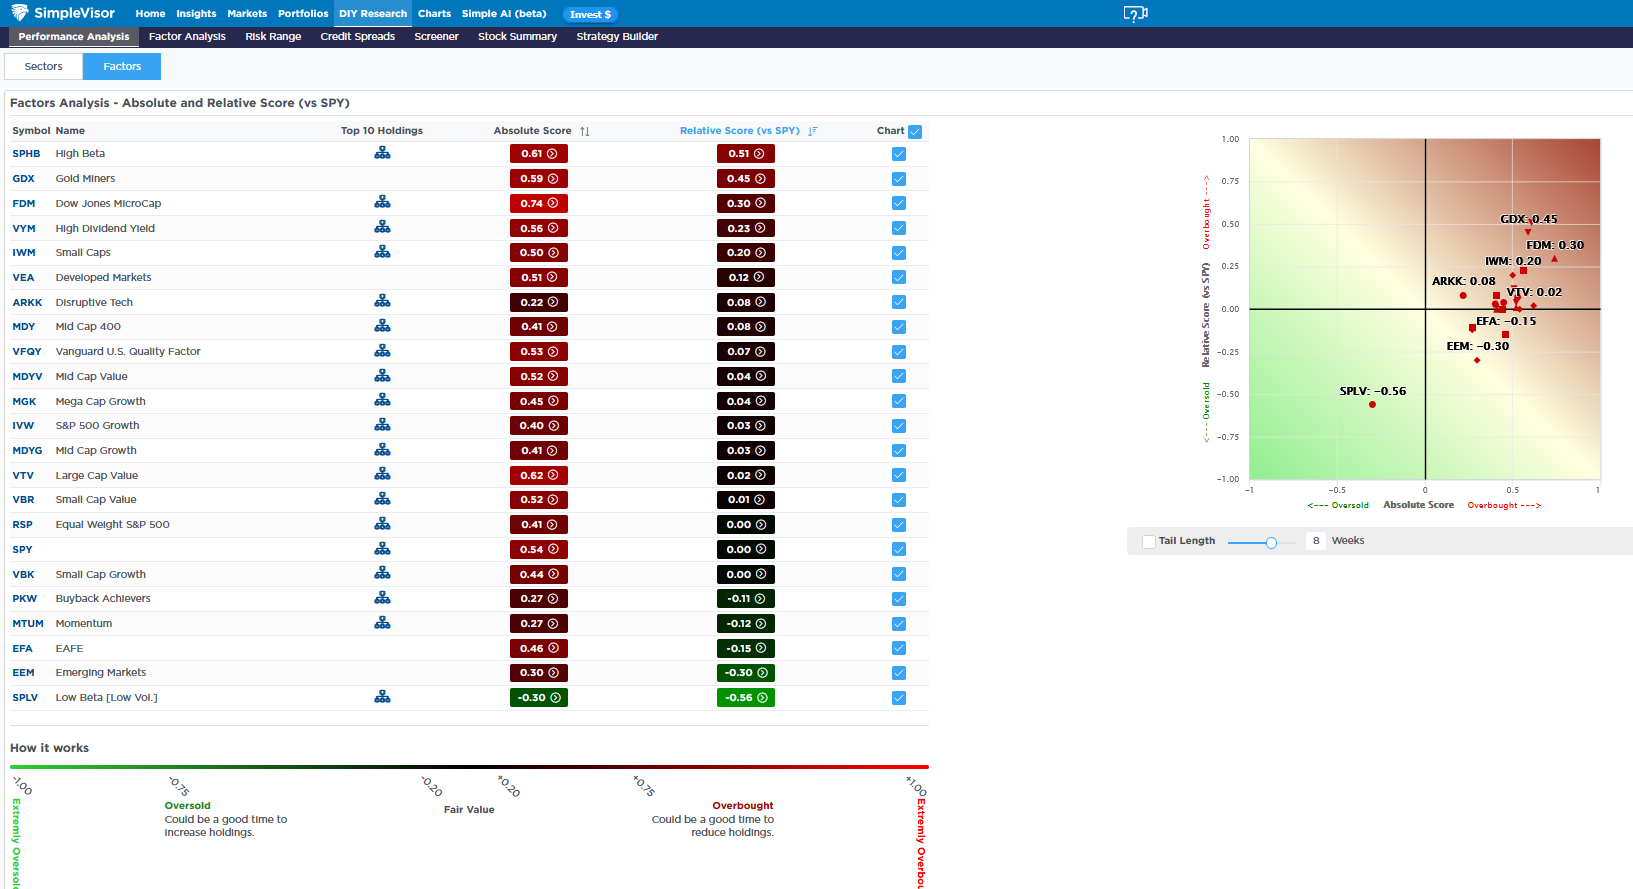
As we share below, courtesy of SimpleVisor, all but one of the stock factors is overbought on an absolute basis. The one oversold factor is low-beta stocks. Interestingly, the high dividend yield factor is among the most overbought sectors. Generally, over the last six months, low-beta, high-dividend, small-cap, and value-oriented sectors have had similar scores and, for the most part, been among the worst performers. The current divergence is unique for this cycle. Similarly, note the divergence between emerging and developed markets. And for that matter, the separation between small-cap value and small caps.
Sector analysis shows that interest rate-sensitive sectors, especially utilities, are oversold relative to the market. It’s worth noting that natural gas prices are up by more than 50% since mid-October. Given that many utilities’ customer pricing is regulated, the higher prices of its primary input are weighing on margins.
(Click on image to enlarge)
The DPI Link To Margin Debt
A recent article by Simon White, via Bloomberg, discussed the rising cost of margin debt for investors. While his analysis below compares the cost of debt to GDP, we will also consider a more critical comparison to disposable personal income (DPI). Here is Simon’s point.
“Yet, where history does raise a red flag is if we look at the cost of carrying the margin debt. Based on an idea from Investec Research, we can estimate the total cost of carrying margin debt versus GDP (I also adjust margin debt for credit balances). This net margin debt has only been higher in the pandemic, when savings went through the roof. As we can see, cost-of-carry peaks for net margin debt have preceded significant downward moves in stocks: the tech bust in 2000, the GFC bear market in 2008, the near 20% correction in 2018 and the 2022 bear market.“
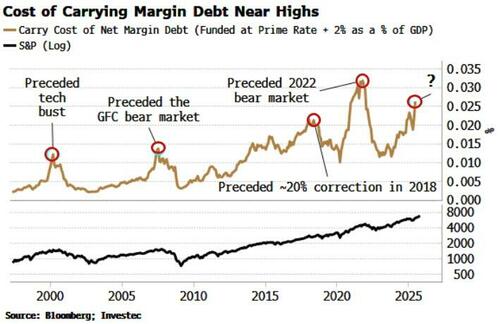
Before we proceed with our discussion, margin debt now stands at a record of more than $1.1 trillion, up nearly 40% on an annual basis.
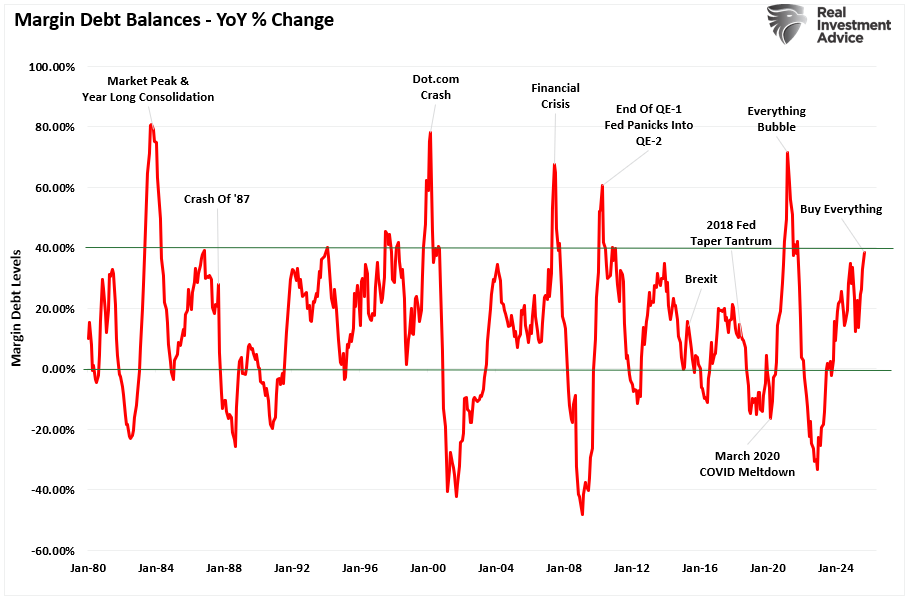
Why is that important? It is essential to reiterate a crucial point about margin debt.
“Margin debt is not a technical indicator for trading markets. What it represents is the amount of speculation occurring in the market. In other words, margin debt is the “gasoline,” which drives markets higher as the leverage provides for the additional purchasing power of assets. However, leverage also works in reverse, as it supplies the accelerant for more significant declines as lenders “force” the sale of assets to cover credit lines without regard to the borrower’s position.
The last sentence is the most important. The issue with margin debt is that the unwinding of leverage is NOT at the investor’s discretion. That process is at the discretion of the broker-dealers that extended that leverage in the first place. (In other words, if you don’t sell to cover, the broker-dealer will do it for you.) When lenders fear they may not recoup their credit lines, they force the borrower to put in more cash or sell assets to cover the debt. The problem is that “margin calls” generally happen simultaneously, as falling asset prices impact all lenders simultaneously.“
In other words, the risk with margin debt is:
“Margin debt is a double-edged sword, and the edge that cuts you, cuts the deepest.”
So, why are we discussing this? READ MORE…
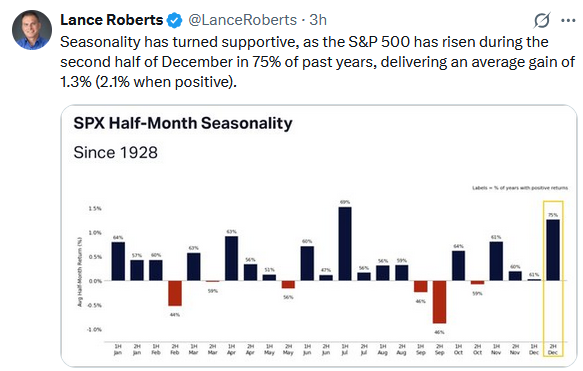
Tweet of the Day
More By This Author:
The DPI Link To Margin Debt1 Million Layoffs
Bullish Case Or Bearish Backdrop


Comments
Log in or sign up to join the conversation.