
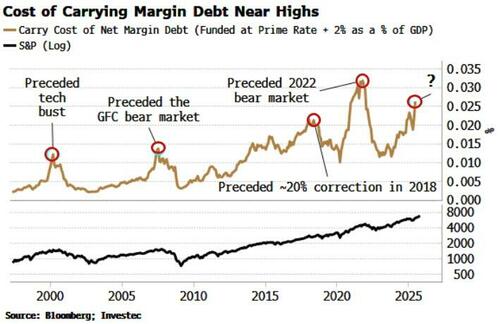
A recent article by Simon White, via Bloomberg, discussed the rising cost of margin debt for investors. While his analysis below compares the cost of debt to GDP, we will also consider a more critical comparison to disposable personal income (DPI). Here is Simon’s point.
“Yet, where history does raise a red flag is if we look at the cost of carrying the margin debt. Based on an idea from Investec Research, we can estimate the total cost of carrying margin debt versus GDP (I also adjust margin debt for credit balances). This net margin debt has only been higher in the pandemic, when savings went through the roof. As we can see, cost-of-carry peaks for net margin debt have preceded significant downward moves in stocks: the tech bust in 2000, the GFC bear market in 2008, the near 20% correction in 2018 and the 2022 bear market.“
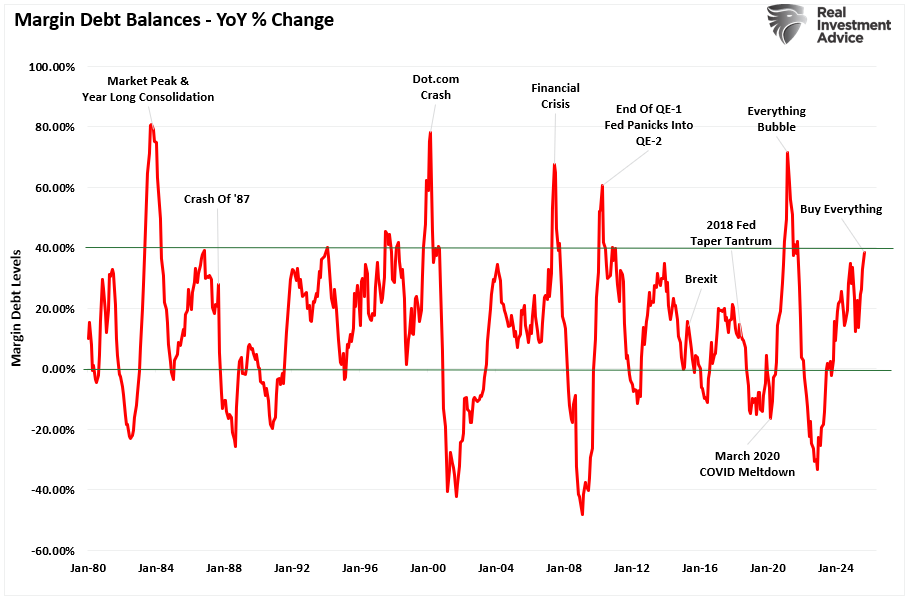
Before we proceed with our discussion, margin debt now stands at a record of more than $1.1 trillion, up nearly 40% on an annual basis.
Why is that important? It is essential to reiterate a crucial point about margin debt.
“Margin debt is not a technical indicator for trading markets. What it represents is the amount of speculation occurring in the market. In other words, margin debt is the “gasoline,” which drives markets higher as the leverage provides for the additional purchasing power of assets. However, leverage also works in reverse, as it supplies the accelerant for more significant declines as lenders “force” the sale of assets to cover credit lines without regard to the borrower’s position.
The last sentence is the most important. The issue with margin debt is that the unwinding of leverage is NOT at the investor’s discretion. That process is at the discretion of the broker-dealers that extended that leverage in the first place. (In other words, if you don’t sell to cover, the broker-dealer will do it for you.) When lenders fear they may not recoup their credit lines, they force the borrower to put in more cash or sell assets to cover the debt. The problem is that “margin calls” generally happen simultaneously, as falling asset prices impact all lenders simultaneously.“
In other words, the risk with margin debt is:
“Margin debt is a double-edged sword, and the edge that cuts you, cuts the deepest.”
So, why are we discussing this? Because margin debt levels are reaching a point where forward market returns are substantially lower.
Which brings us back to Simon White and the cost of carrying margin debt.
The Link Between Disposable Personal Income and Margin Debt
Currently, household allocations to equities are at a record. Of course, such should be unsurprising given the strong market advances over the past few years.

There is more to this story than just rising asset prices. When investors are chasing a bull market, they initially invest their savings in the financial markets. If prices continue to rise, they then turn to margin debt to continue investing. However, as noted above, that is a “bullish benefit” to the market as the leverage increases investors’ “buying power.”
However, margin debt is not “free,” and generally carries an interest rate that is two percentage points above the bank’s “prime lending” rate. Currently, the bank’s prime lending rate is around 7%, which suggests that most margin debt is carrying an interest rate of 9%. Therefore, investors must consider the interest rate risk associated with the borrowed capital to generate a profit. Over the last three years, returns of 10% or more have been relatively easy, at least so far.
But that brings us to our warning. Understanding the link between disposable personal income (DPI) and margin debt is crucial for assessing market risk. DPI is the income households have after taxes, available for saving or investing. When DPI growth slows, households have fewer fresh savings to deploy. In this context, some investors turn to margin borrowing to maintain or increase exposure.
In the second quarter of 2025, U.S. Disposable Personal Income (DPI) stood at approximately $22.858 trillion on a seasonally adjusted annual rate basis. This figure represents a nominal increase from $22.564 trillion in Q1 2025. While that growth suggests income levels are still rising, further data paint a more nuanced picture of investor capacity and market risk. Real disposable personal income (adjusted for inflation) for Q2 2025 grew by about 3.1% year‑over‑year. This growth rate remains below the long‑term average of roughly 3.44%. In practical terms, households are seeing slower growth in their “money left over” after taxes and basic costs, reducing the flow of new savings that could be invested.
Margin debt as a percentage of real DPI has been reported at around 6.23 %, the highest on record. This ratio also suggests that for every $100 of real DPI, roughly $6 of margin debt is outstanding, a non‐trivial amount.
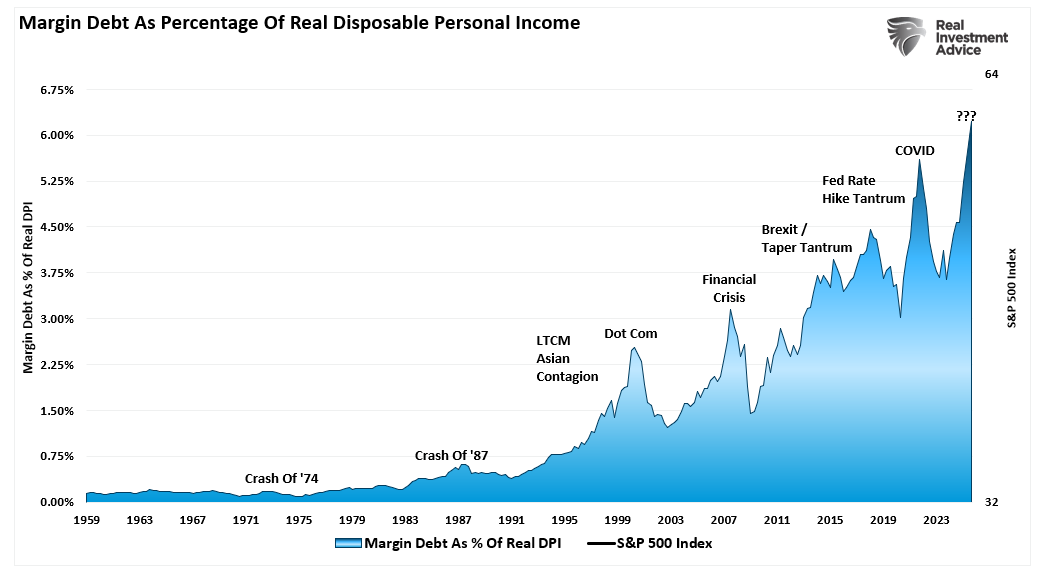
Naturally, when fresh savings are lacking and investors turn to margin to participate in markets, two risks emerge.
- The quality of the investor base weakens because borrowed money replaces savings.
- The carrying cost of that borrowing becomes more salient when interest rates are elevated. If the margin debt carries higher interest and investors’ income growth is weak, servicing the debt becomes harder, reducing the buffer against loss.
In summary, weak DPI growth, combined with elevated margin borrowing, creates a vulnerability. In such an environment, the investor base is much less resilient.
The “Cost Of Carry”
In recent years, not only has margin debt surged, but the “cost of carrying” that debt has also risen. As borrowing costs increase, the break‐even point for leveraged equity exposure rises. If an investor borrows at a higher interest rate and the market stagnates or declines, the drag from interest and margin loan costs erodes returns. Simon’s view of carrying costs as a percentage of GDP is correct. However, another salient perspective is to consider them as a function of DPI. In other words, if an investor account is fully invested, margin interest must be paid either by selling assets or from disposable income.

With margin debt expense as a percentage of DPI at the highest level on record, the risk of market reversal becomes elevated. Higher interest rates also mean that margin borrowing becomes less attractive relative to other uses of capital. If margin rates rise, investors holding prominent borrowed positions may face higher servicing costs and increased pressure in the event of a correction. In such an environment, as shown above, the historical outcome has been one of increased financial fragility.
Moreover, elevated rates can suppress earnings growth across the economy, reducing incentive returns and market momentum. For leveraged investors, slower earnings growth makes it harder to absorb the cost of borrowing. Therefore, from a market‑structure perspective, the combination of high margin debt and high borrowing costs creates a vulnerability:
- Leverage is greater.
- Investor income growth is weaker.
- The carrying cost of debt is higher.
These three factors form a feedback loop: high costs and weak income reduce investor resilience; a market drawdown triggers margin calls, which in turn accelerate the decline through forced selling. Academic models of margin trading indicate that this type of feedback loop can transform a modest correction into a sharper decline.
Thus, rising carrying costs of margin debt amplify the risk embedded in the margin debt–DPI link.
Implications for Investors and Portfolio Strategy
In an environment where the bull market is being fueled by rising margin debt and modest income growth, investors face a delicate balance. You don’t need to exit the market, but you do need to be more aware of the risks. Recognizing how leverage influences market behavior and how shifts in personal income and debt servicing costs interact with that leverage is key to protecting capital and adjusting expectations.
The reality is this: investors are still chasing returns, and the market continues to reward that behavior for now. Rising asset prices, especially in large-cap tech and momentum-driven sectors, are being supported by a growing use of borrowed money. Margin debt is climbing, not because household incomes are surging, but because many investors have limited savings and are reaching for returns through leverage.
Therefore, while you can still participate in this market, you must remain disciplined.
- Stay invested, but with safeguards. If you want to remain exposed to equities, focus on quality, such as strong balance sheets, free cash flow, and consistent earnings, which matter more when leverage is elevated. Reduce exposure to speculative names or highly volatile trades that attract margin-fueled momentum.
- Know your leverage exposure. Even if you aren’t using margin directly, you might be exposed indirectly through funds or ETFs that include highly leveraged or sentiment-driven holdings. A review of your portfolio’s beta and sector concentration can help you gauge that.
- Watch the signals. Keep an eye on shifts in disposable personal income growth, margin debt trends, and interest rate policy. If DPI growth turns negative, or margin debt begins to contract rapidly, that’s a sign that liquidity is drying up. Those moments often precede corrections. Also, watch for margin call activity reported by brokers and spikes in volatility indexes, such as the VIX.
- Raise cash selectively. When markets are rising but driven more by leverage than earnings growth, trimming profits and raising money doesn’t mean market timing—it means risk management. A modest cash buffer can help you act decisively if a dislocation creates opportunities or threats.
- Respect interest rate sensitivity. As rates remain elevated, the cost of carrying margin debt is not trivial. If the Fed raises again or even holds at current levels, the drag from interest expense will grow in a flat or declining market, which can quickly turn into forced liquidation for heavily leveraged investors.
- Focus on the trend, but prepare for the turn. A market built on borrowed money can climb higher than expected, but the turn often comes fast. If the data show increasing margin usage while income growth stalls or turns negative, that’s your cue to move from offense to defense.
In short, the current bull run is not entirely organic. It’s partially fueled by borrowing, supported by sentiment, and heavily influenced by the belief that the Federal Reserve will always intervene. The concept of “moral hazard“ has led to historic excesses in various forms, which have, without fail, ultimately resulted in disappointing outcomes.
That doesn’t mean it ends tomorrow, but it does mean you should stay alert. Participation is fine—complacency is not. When the fuel for the rally is credit, rather than cash flow, history shows that reversals are swift and unforgiving.
Stay in the game, but keep your guard up.
More By This Author:
1 Million Layoffs
Bullish Case Or Bearish Backdrop
Jobs Data From Alternative Sources May Drive Fed’s Next Move


Comments
Log in or sign up to join the conversation.