
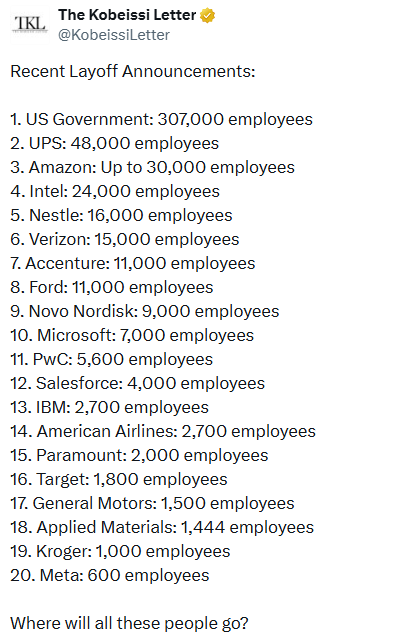
U.S. employers have announced over 1 million layoffs this year, the highest annual total since the pandemic-era collapse in 2020. November alone saw more than 71,000 layoffs announced, keeping pressure on sectors from technology to telecoms even as the equity market pushes higher. The post below, courtesy @KobeissiLetter, details some of this year’s announcements.
The jump in planned layoffs comes as weekly unemployment claims remain relatively tame. Evidence that firms are still leaning on hiring freezes and attrition rather than outright cuts. But the sheer scale of announced layoffs surpassing 1 million suggests there could be a deeper structural weakness. On a cumulative basis, 2025 ranks as one of the worst labor-market years outside of recession periods.
Much of the optimism around stocks this year has rested on expectations of eventual rate cuts and strong consumer spending. But if the labor tide has turned with 1 million layoffs on the horizon and growing income uncertainty, consumption could falter, and the outlook for growth-sensitive assets becomes murkier.
What To Watch Today
Earnings
(Click on image to enlarge)
![]()
Economy
(Click on image to enlarge)
![]()
Market Trading Update
The technical foundation for the S&P 500 looks bullish following this week’s rally. With a Friday close at 6,870, the price remains above key moving averages and just under near‑term resistance, which is a bullish setup but suggests careful attention to support/resistance zones.
As shown in the daily chart below, the technical indicators remain favorable. The 50-day moving average is currently positioned near 6,744, and the 200-day moving average is approximately 6,195, both of which are below the current price, providing a base of support in the event of a pullback. Furthermore, the market is on a momentum “buy signal,” and relative strength is improving along with breadth as noted above. All of this suggests that the current uptrend remains intact, with buyers still in control. Despite the “angst” of the first two weeks of November, the market has been digesting the rather massive gains from the April lows.
(Click on image to enlarge)
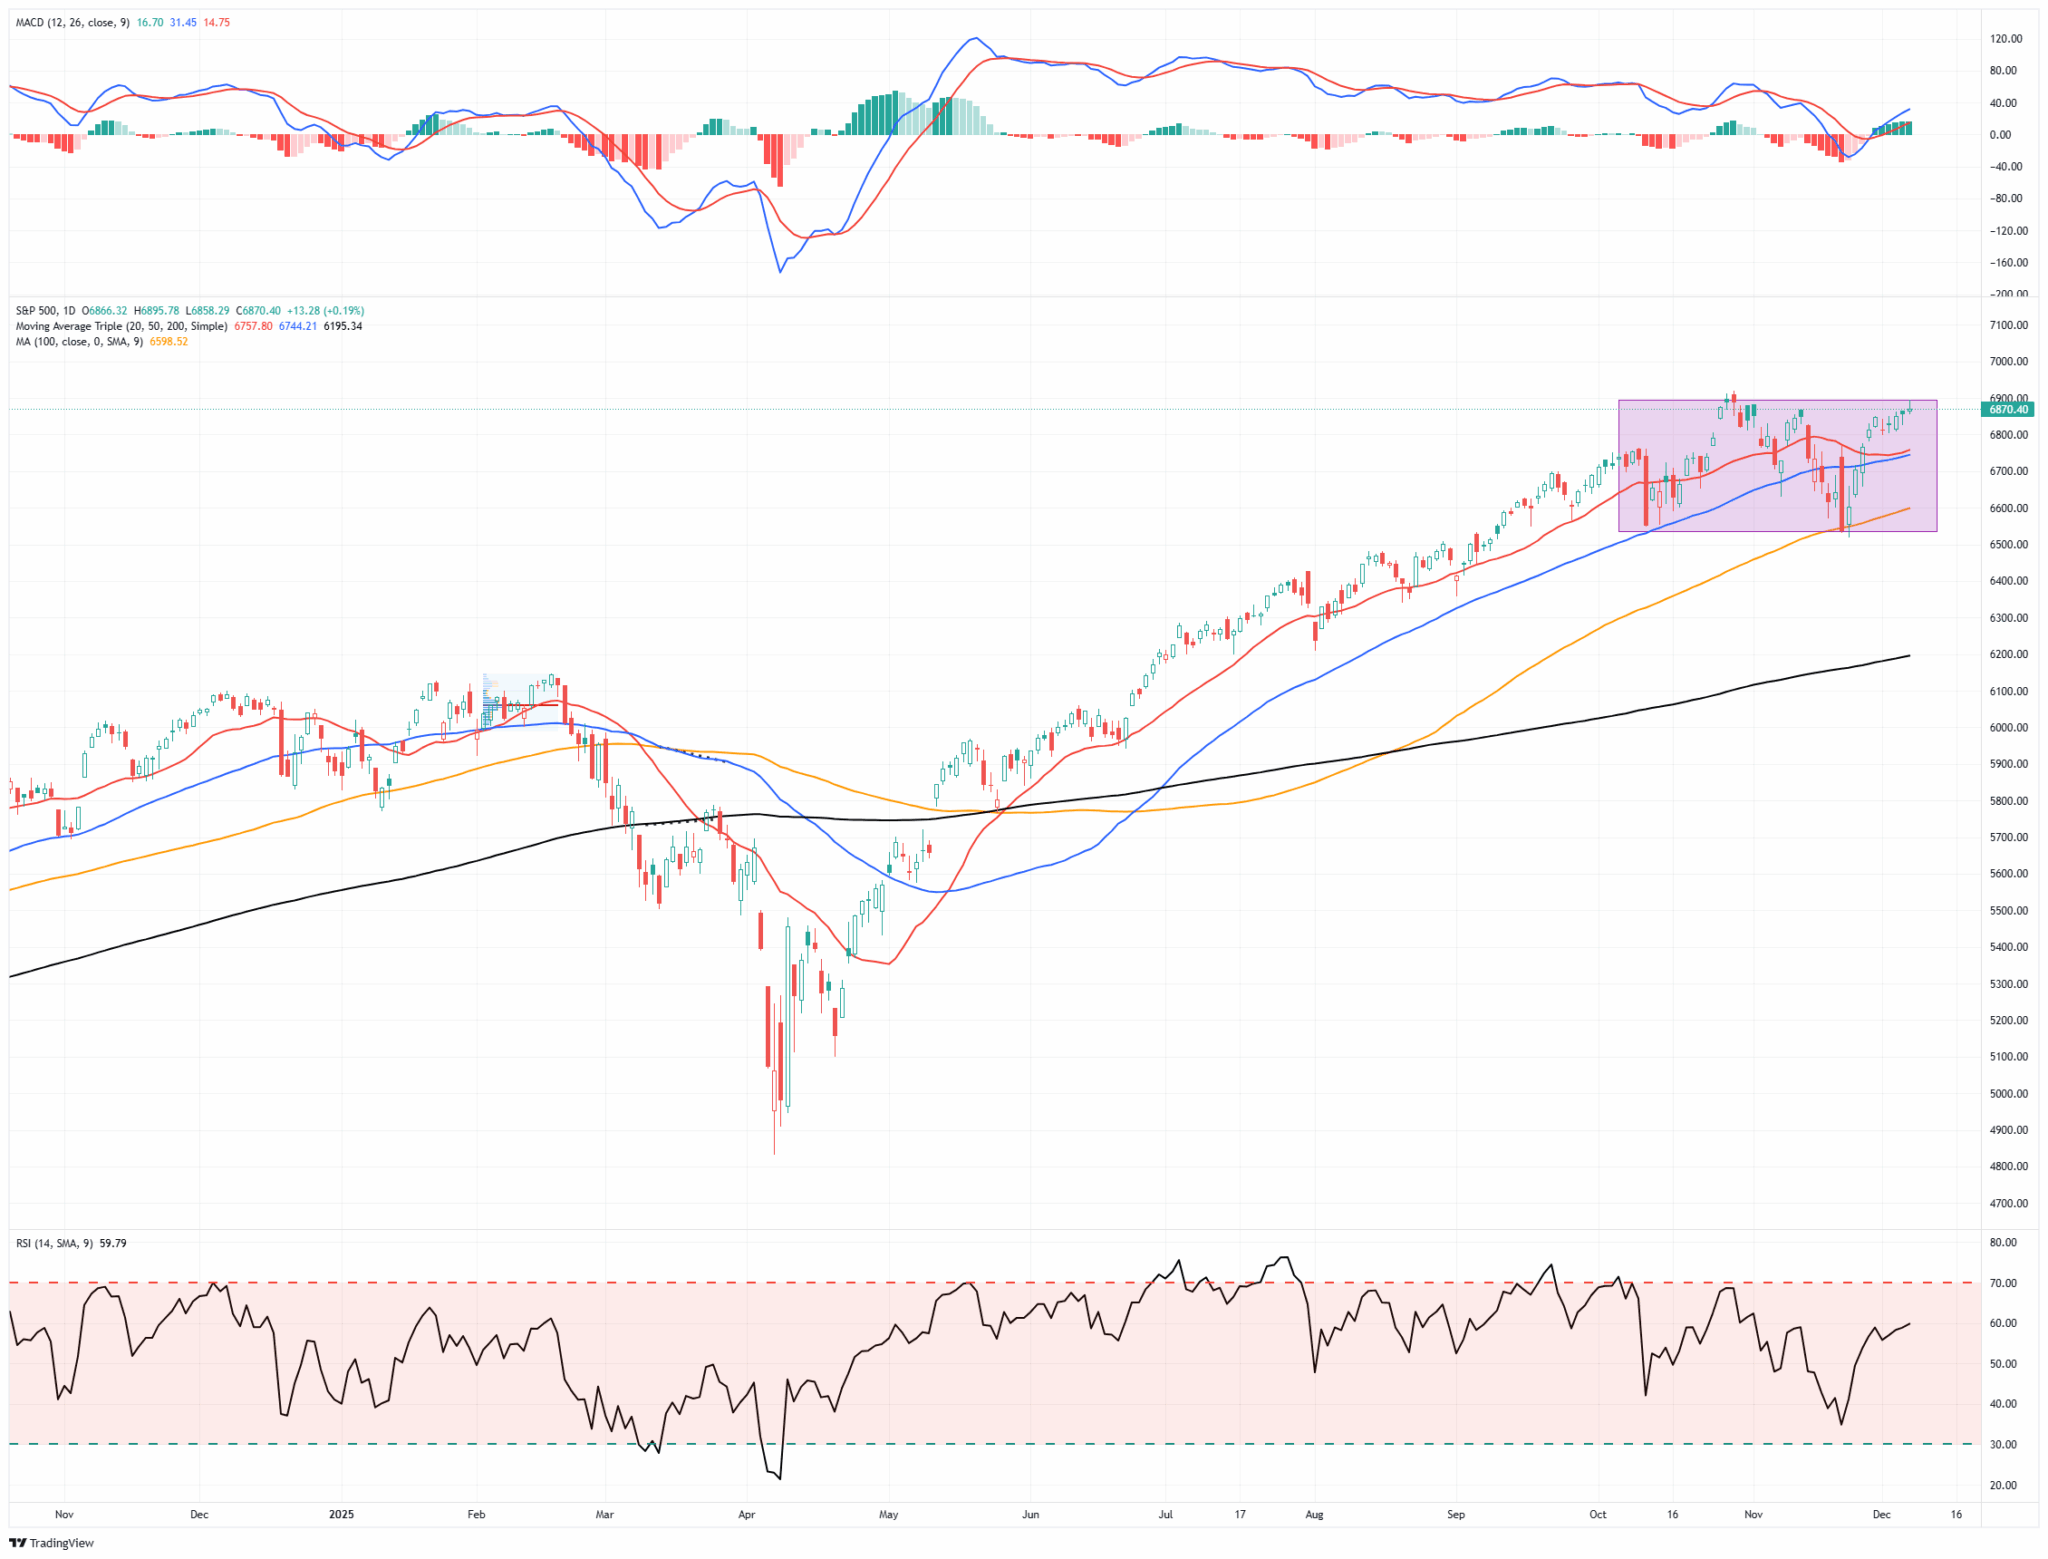
Support and Resistance Zones
Based on the 6,878 close and the latest available pivot‑point and technical data, key zones to watch in the coming sessions:
- Immediate support: ~ 6,744 – 6,757 (20- and 50-day moving average cluster)
- Secondary support: ~ 6,598 (100‑day moving average) — a zone that, if broken, would signal weakening of the broader uptrend.
- Critical Support ~6,195 (200-day moving average) – if this level fails, the market will be facing a larger corrective action.
- Near‑term resistance: ~ 6,885 – 6,900 as markets approach previous rally peaks and all-time highs
- Major resistance/breakout zone: ~ 6,920–6,940 would clear previous all-time highs moving next resistance to top of current trend line near ~7,000
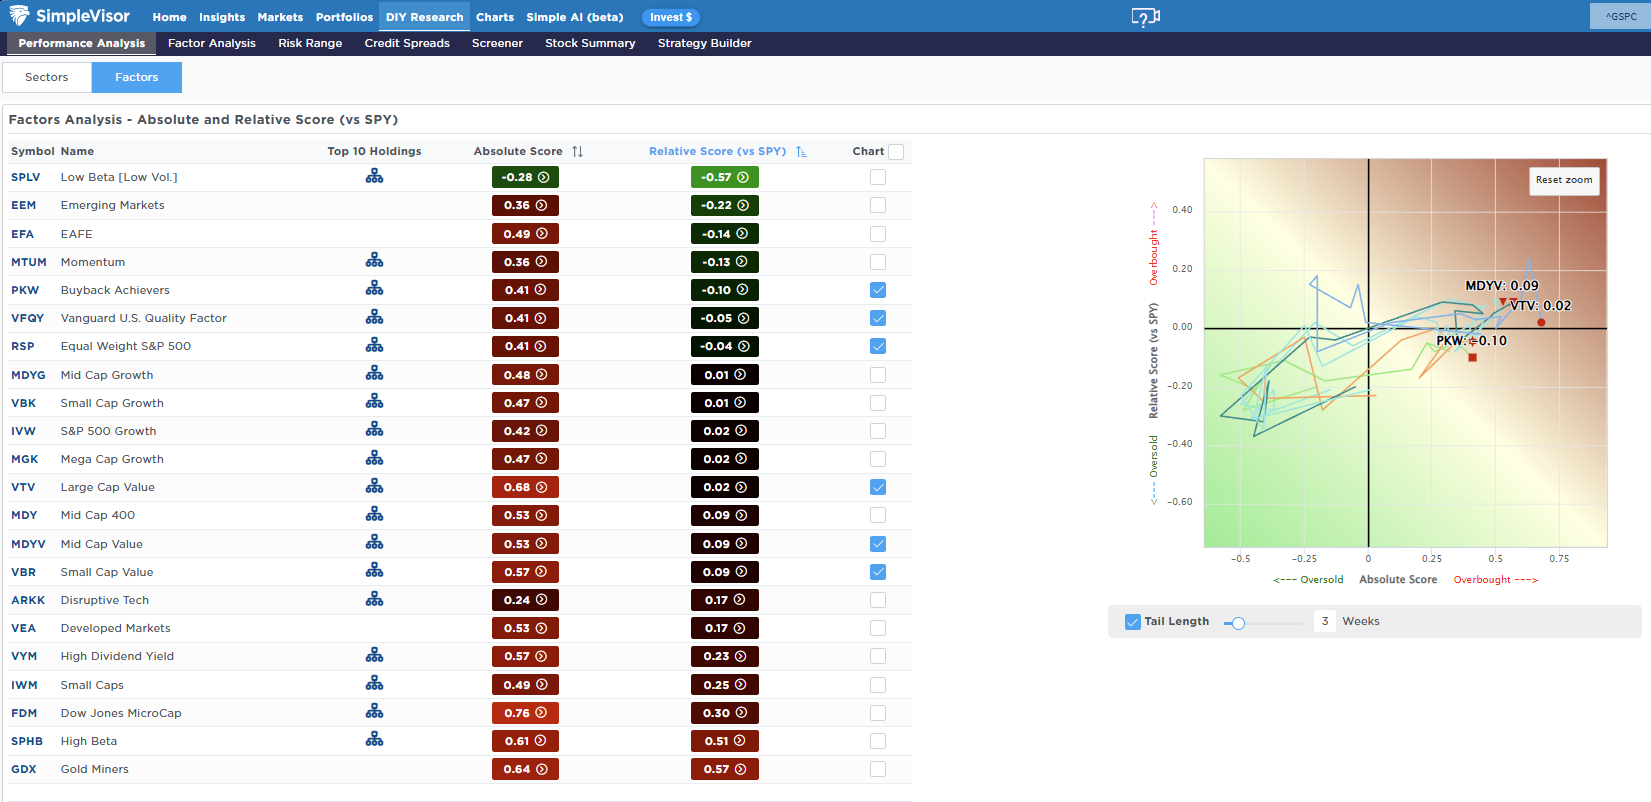
The rally this past week showed signs of expanding beyond just the most significant growth and AI‑related names. As discussed last week, some underappreciated sectors, such as value and cyclical-linked areas, registered relative gains. That diversification in participation tends to support the durability of a bullish uptrend.
Caution flags also emerged and are worth paying attention to. While the market gained ground, volume was modest, suggesting many investors remain hesitant and are not fully committing. If this remains the case, the risk of a rally built primarily on liquidity and short-term positioning, rather than broad conviction, is susceptible to swift reversals in investor sentiment. Additionally, with prices exceeding the 200-day averages, the risk of a correction also increases.
Overall, the technical backdrop is bullish but is not devoid of risk. Continue to maintain a disciplined approach, respect support and resistance levels, and manage risk exposures accordingly.
The Week Ahead
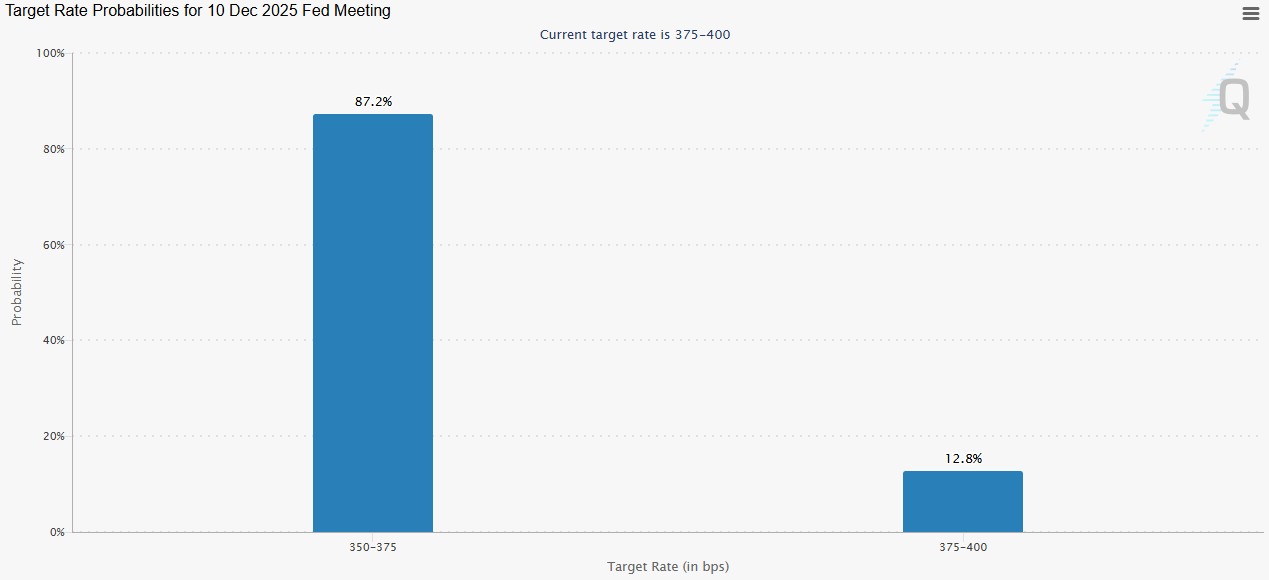
This week will be dominated by the FOMC meeting on Wednesday. The Fed Funds Futures market expects the Fed to cut rates by 0.25% for the third consecutive meeting. Given a growing number of Fed dissenters this year, the Summary of Economic Projections will be in focus to assess FOMC alignment. In particular, investors will be looking for divergences in FOMC member forecasts of inflation, the unemployment rate, and expected number of further rate cuts as we head into 2026.
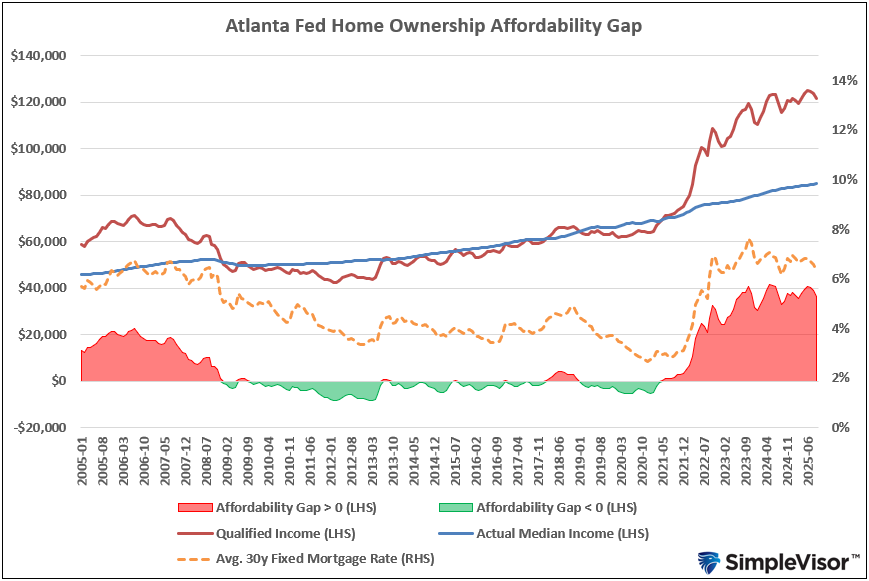
Home Affordability Looks Grim
The Federal Reserve Bank of Atlanta’s home ownership affordability index is painting an ominous picture. The tool calculates the affordability gap as the difference between the “qualified income” and the actual median US household income. Qualified income is the amount required for annual homeownership costs to equal no more than 30% of income, using the median US home price. When qualified income exceeds the actual median income, the affordability gap turns positive and vice versa.
The chart below illustrates that the affordability gap, whether positive or negative, is typically small. Occasionally, it departs from that pattern. The last time the affordability gap grew this large was in July 2006, near the peak of the housing bubble. At the time, the qualified income was 46.3% higher than the actual median income. As of September 2025, the qualified income was 43.1% higher than the median US household income.
While home prices have outpaced income growth since 2020, the chart points to a larger culprit. It shows a clear connection between rising interest rates and the burgeoning affordability gap. If history serves as a guide, then something needs to give. Whether that’s home prices, mortgage rates, household incomes, or a combination remains to be seen. Until then, activity in the housing market is bound to stay muted.
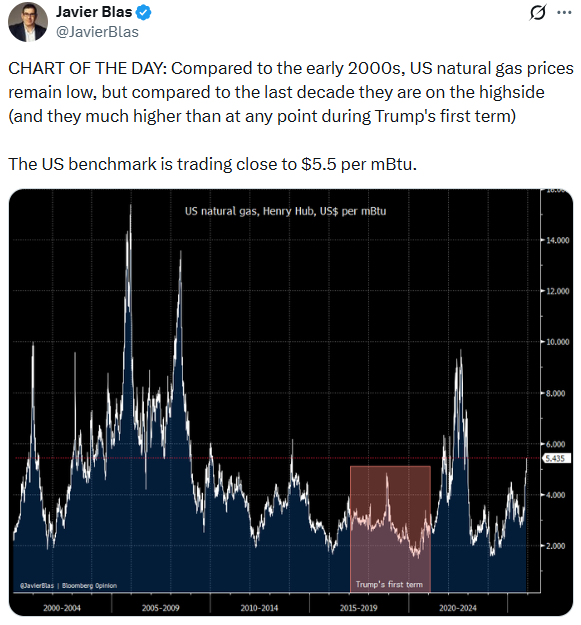
Tweet of the Day
More By This Author:
Bullish Case Or Bearish BackdropJobs Data From Alternative Sources May Drive Fed’s Next Move
5x Leverage Is Too Much Says The SEC


Comments
Log in or sign up to join the conversation.