

Image Source: Pixabay
It is well documented in the literature that retail investors have an irrational preference (from a traditional finance perspective) for investing in high-volatility stocks which have lottery-like distributions—those that exhibit positive skewness and excess kurtosis (fat tails). Studies, such as the 2023 papers “Lottery Preference and Anomalies” and “Do the Rich Gamble in the Stock Market? Low Risk Anomalies and Wealthy Households,” the 2022 paper “Lottery Demand and the Asset Growth Anomaly,” and the 2014 paper “Do Investors Overpay for Stocks with Lottery-like Payoffs? An Examination of the Returns on OTC Stocks,” have found that retail investor “taste” for lottery-like distributions leads to higher prices for such stocks, resulting in poor returns. Among the stocks with lottery-like distributions are “penny stocks.” The term “penny stock” generally refers to equities with a share price under $5—it is the definition that the SEC uses, and it tends to be the cutoff used in academic research.
The Performance of Penny Stocks
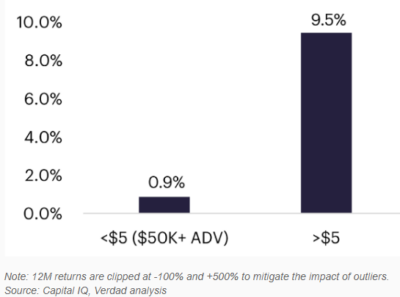
The research team at Verdad took a deep dive into the performance of penny stocks. Their database covered 1996-May 2024 and included stocks on the NYSE, AMEX, and Nasdaq trading below $5. To address the issue of implementability with illiquid stocks (such as penny stocks) they excluded those that did not have at least $50,000 in average daily volume. To address the issue of outliers, 12-month returns were “clipped” at -100% and +500%.
As you can see in the chart below, excluding the outliers, stocks that traded below $5, and also had at least $50,000 in daily average volume, underperformed those trading above $5 by 8.6 percentage points a year.
The results are hypothetical results and are NOT an indicator of future results and do NOT represent returns that any investor actually attained. Indexes are unmanaged and do not reflect management or trading fees, and one cannot invest directly in an index.
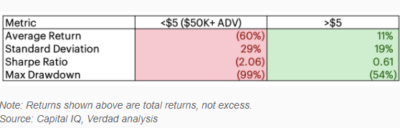
The table below shows the cap-weighted performance of these stocks. Note that while the average return to these stocks was 0.9% per annum, the cap-weighted return for stocks trading below $5 was -60%—demonstrating the extreme positive skewness and fat tail of their individual returns. Also note that their standard deviation was more than 50% higher (29% versus 19%) than that of stocks trading above $5. The high volatility and poor returns resulted in a Sharpe ratio of -2.06 versus 0.61 for the stocks trading above $5. And the average maximum drawdown was almost twice as great (-99% versus -54%).
The results are hypothetical results and are NOT an indicator of future results and do NOT represent returns that any investor actually attained. Indexes are unmanaged and do not reflect management or trading fees, and one cannot invest directly in an index.
The behavioral explanation for why investors would have a preference for stocks with such poor historical results is that investors love to play the “lottery”—accepting the high likelihood of a poor result in return for obtaining the chance, however small, for winning the “lottery.”
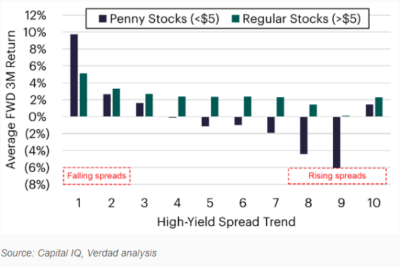
Verdad then examined if they could determine if there were periods when “penny stocks” did outperform. Given that their prior research had identified that changes in the high-yield spread provided information as to future security returns, they examined the performance of penny stocks versus other stock returns against the change in the high yield spread—the difference between the borrowing rate for below-investment grade corporate debt and the rate on U.S. Treasuries. Higher (lower) spreads indicate tighter (looser) financial conditions and weakening (strengthening) macroeconomic conditions.
They found that penny stocks outperformed other stocks only when the high-yield spread was falling at the fastest rate (the first decile in the chart below), while performing extremely poorly when high-yield spreads were rising.
They noted:
“High-yield spreads tend to fall most rapidly after sharp rises in spreads, which tend to coincide with periods of market panic. This is consistent with our prior research on crisis investing.”
In other words, penny stocks tend to outperform following periods of extreme negative sentiment (as is the case with high-yield bonds).
The results are hypothetical results and are NOT an indicator of future results and do NOT represent returns that any investor actually attained. Indexes are unmanaged and do not reflect management or trading fees, and one cannot invest directly in an index.
Their findings led them to conclude:
“Penny stocks generally have unattractive investment characteristics, with lower average returns and higher volatility than regular stocks. However, we believe the most liquid subset offers a source of predictable, compelling returns following periods of market panic, which we can time using the high-yield spread.”
Investor Takeaways
Fund families whose investment strategies are based on academic research, such as Alpha Architect, AQR, Avantis, Bridgeway and Dimensional Fund Advisors, have long excluded from their eligible universe stocks with lottery characteristics. Thus, the main takeaway should be that an efficient way to improve the expected performance of an equity strategy would be to systematically exclude penny stocks, as well with high asset growth and extreme past returns, especially if they have low profitability (and exclude funds that don’t screen out such stocks). For investors willing to accept the risks involved in attempting to time the market, Verdad showed that there are rare periods when buying these penny stocks has been profitable—when the high yield spread is collapsing.
More By This Author:
Moving Average Distance And Time-Series Momentum
Examining The Performance Of Stone Ridge’s Reinsurance Premium Interval Fund
Band Of Brothers Attacking Short Sellers: Game Stopped For Hedge Funds?


Comments
Log in or sign up to join the conversation.