
Equity bulls agonizingly failed to turn a potentially lucrative technical setup on the S&P 500 to their advantage. The Russell 2000 already has not been able to escape a two-plus-year range and the Nasdaq 100 has of late transitioned from a leader to a laggard.
(Click on image to enlarge)
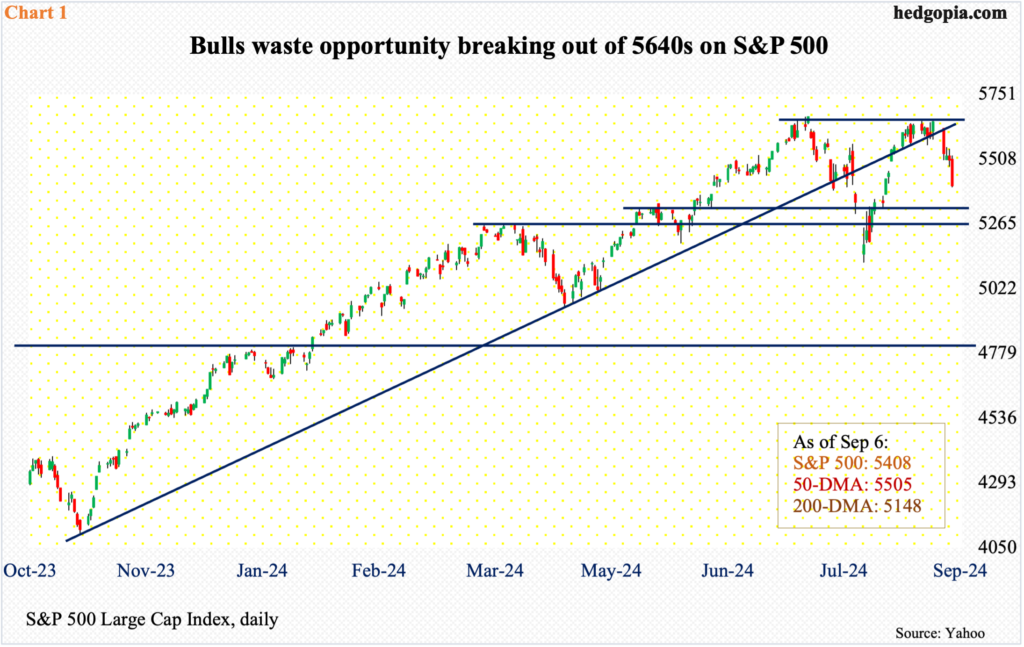
The S&P 500 peaked on July 16th at 5670 and shed just under 10 percent by August 5th when the large cap index bottomed at 5119. The recovery since has been impressive, as by the 26th it had rallied to within 18 points of its high.
In fact, heading into last week’s trading, the S&P 500 had gone sideways at 5640s for seven sessions (Chart 1), closing the week right at that level (Chart 1). This was an opportunity for the bulls to regroup, stage a breakout and see what happens at the July high. However, this is not how things evolved last week, which only had four trading sessions due to the Labor Day holiday.
The S&P 500 came apart at the seams right from the get-go, as Tuesday decisively closed lower, finding intraday support at the 50-day, with the average continuing to attract bids in the next two sessions. Come Friday, however, the index sliced through the average. In the end, it sank 4.25 percent for the week to 5408, dropping in all four sessions.
Immediately ahead, there is horizontal support at 5320s, and 5260s after that. In the event of a rally in the sessions ahead, the 50-day, which is now flattish to downward-sloping, should genuinely attract shorts. The 200-day – still rising – will not be tested until 5148.
(Click on image to enlarge)
Large-cap bulls’ failure last week to make the most of an opportunity comes amidst small-cap bulls’ defensive posture for months.
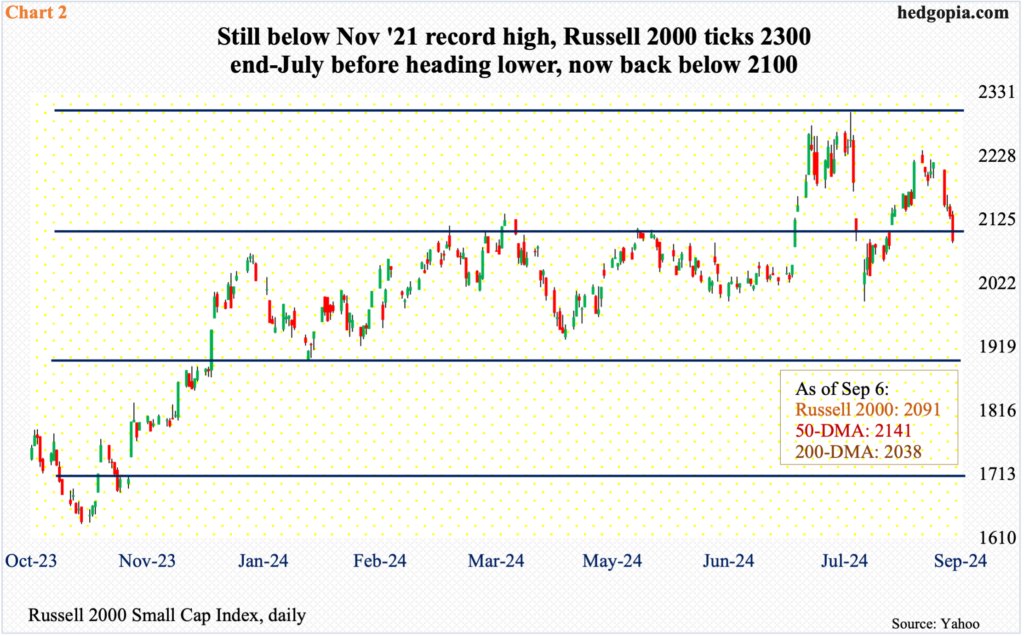
In November 2021, both the Russell 2000 and the Nasdaq 100 peaked. The latter surpassed its high last December and went on to rally 23-plus percent before peaking this July. On the Russell 2000, the November 2021 high remains intact.
The small cap index peaked back then at 2459 and bottomed in June 2022 at 1641, which was successfully tested in October of both 2022 and 2023. Concurrently, beginning January 2022, the index played ping pong between 1700 and 1900. A range breakout occurred last December when Jerome Powell, Federal Reserve chair, made a dovish pivot. The index then entered another range between 1900 and 2100 for seven months before breaking out on July 11th, when the consumer price index for June came in weaker than expected, giving a boost to rate-cutting odds.
Small-caps inherently have a large exposure to the domestic economy than their large-cap cousins. Interest rates matter for these companies, particularly the leveraged ones and the small community and regional banks. The Fed is on pace to begin cutting this month, as a two-day FOMC meeting begins on the 17th. A 25-basis-point cut is priced in. The fed funds rate has been left unchanged at a range of 525 basis points to 550 basis points since July last year. Until March 2022, the benchmark rates were essentially zero-bound – between zero and 25 basis points.
The beginning of an easing cycle – the duration and magnitude of which remains to be seen and will be dependent on how jobs and inflation act in the months and quarters ahead – has stopped positively impacting the Russell 2000. It hit 2300 on July 31st, swiftly dropped to 1993 on August 5th, rallied to 2238 by the 26th and is now back under 2100. Last week, the Russell 2000 sank 5.7 percent to 2091.
If small-cap bulls cannot reclaim 2100, the door opens toward 2000, and 1900 worst-case.
(Click on image to enlarge)
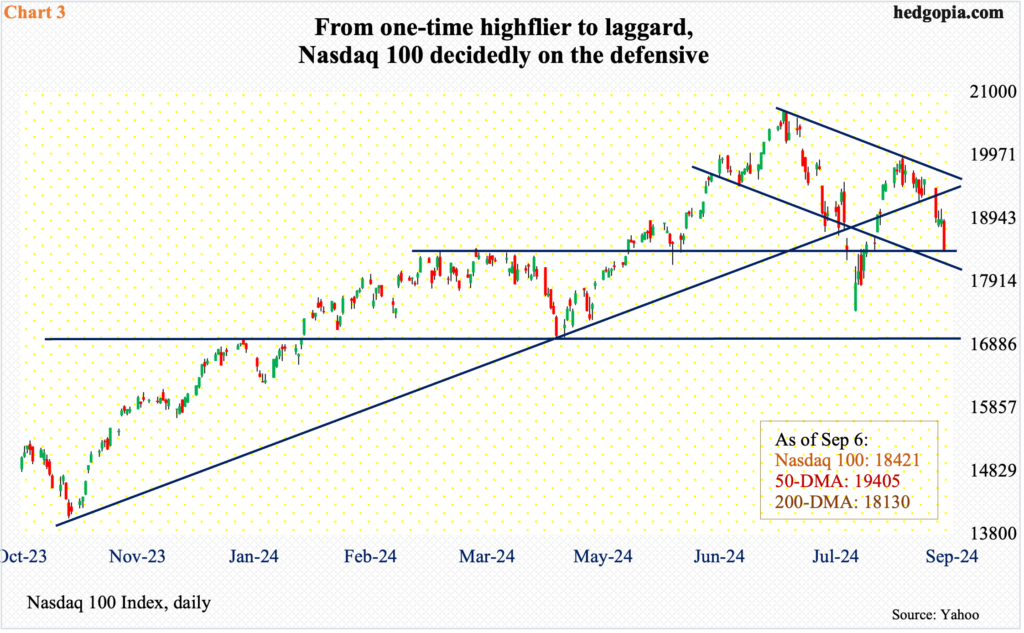
Even though they peaked at the same time in November 2021, the Nasdaq 100 was a cut above the Russell 2000 after they bottomed last October. In recent weeks, however, the one-time leader is beginning to lag.
On July 10th, the Nasdaq 100 peaked at 20691. This was followed by a lower high of 19939 on August 22nd; at the time, the tech-heavy index was still 3.8 percent from its record high. This compares to the S&P 500 which retreated last week after rallying to within 0.3 percent of its high.
The Nasdaq 100 swooned 5.9 percent last week to 18421, closing right at 18420s horizontal support. The 50-day (19405) – pointing down – is gone and the 200-day (18130) is less than 300 points away. Regardless how things shake out in the near-term, it is only a matter of time before the 200-day is breached.
The monthly has just begun to turn lower, and there is a long way to go before the overbought condition the Nasdaq 100 is in on this timeframe is unwound. This also applies to the S&P 500 and the Russell 2000.
More By This Author:
Peeking Into The Future Through CoT Report: Futures, Noncommercial Buyers, How Hedge Funds Are PositionedHedge Funds Positions, Noncommercial Buying - How CoT Peeks Into The Future
Easing Cycle Set To Begin Next Month; Historically, Equities React By Declining


Comments
Log in or sign up to join the conversation.