
Following futures positions of non-commercials are as of September 3, 2024.
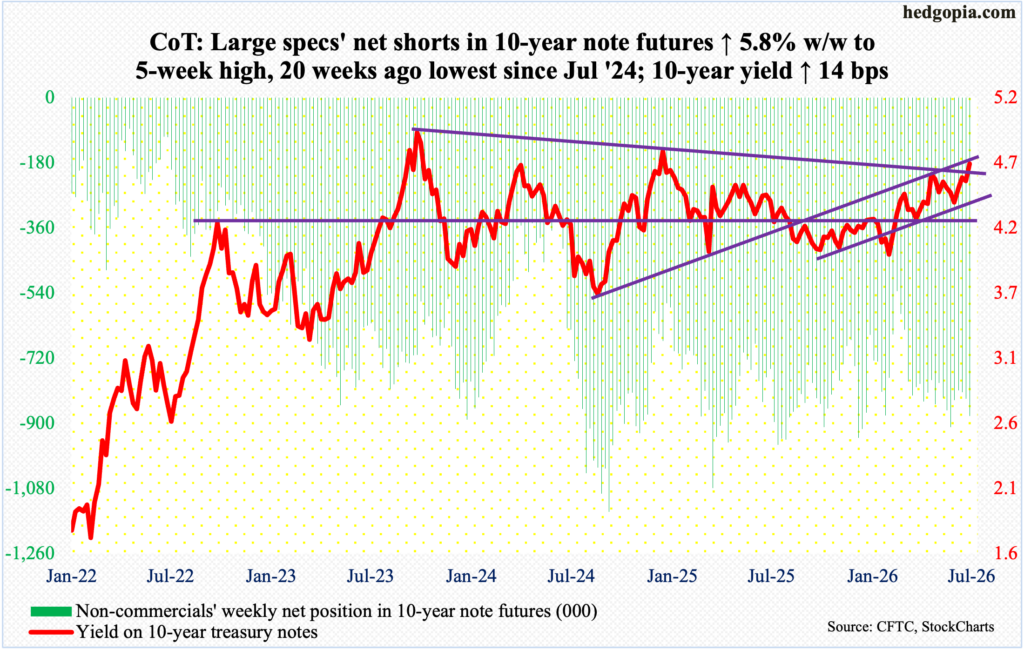
10-year note: Currently net short 1,002.8k, up 88.4k.
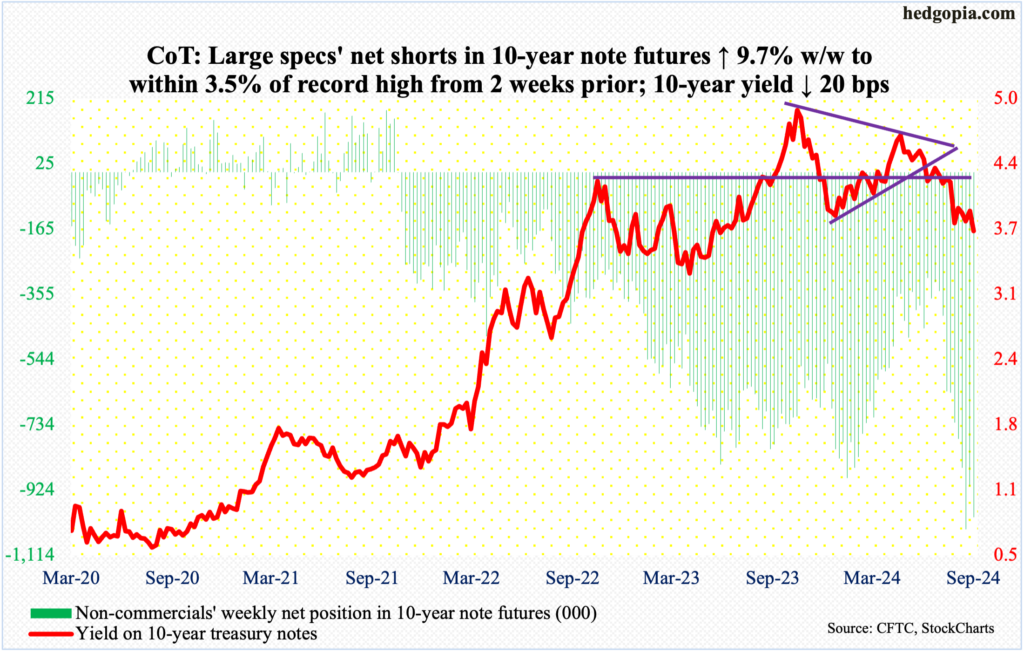
The economy produced a weaker-than-expected 142,000 non-farm jobs in August, even as the unemployment rate ticked down to 4.2 percent, as expected; June and July payrolls saw big downward revisions.
In the fed funds futures market, traders were not convinced this was enough for the Federal Reserve to begin a rate-cutting cycle with a 50-basis-point cut on the 18th this month when a two-day FOMC meeting ends.
Since July last year, the fed funds rate has been left unchanged at a range of 525 basis points to 550 basis points. Earlier, the Fed began to tighten from zero to 25 basis points in March 2022.
Post-jobs report Friday, futures traders are betting with 70 percent probabilities that we would see a 25-basis-point reduction in the benchmark rates, but they also significantly raised the magnitude of cuts by December next year. The rates are now expected to reach between 275 basis points and 300 basis points by then, which equates to a reduction of 250 basis points of cuts in the next 15 months! They are essentially betting on the current downward trajectory in job creation not only to continue but also to get worse. Otherwise, the Fed would have a hard time justifying an easing of this magnitude.
As a corollary, a question arises as to what that might do to corporate earnings, which currently anticipate better things to come next year. If this downbeat scenario comes to pass, there is a long way to go before equities fully reflect this.
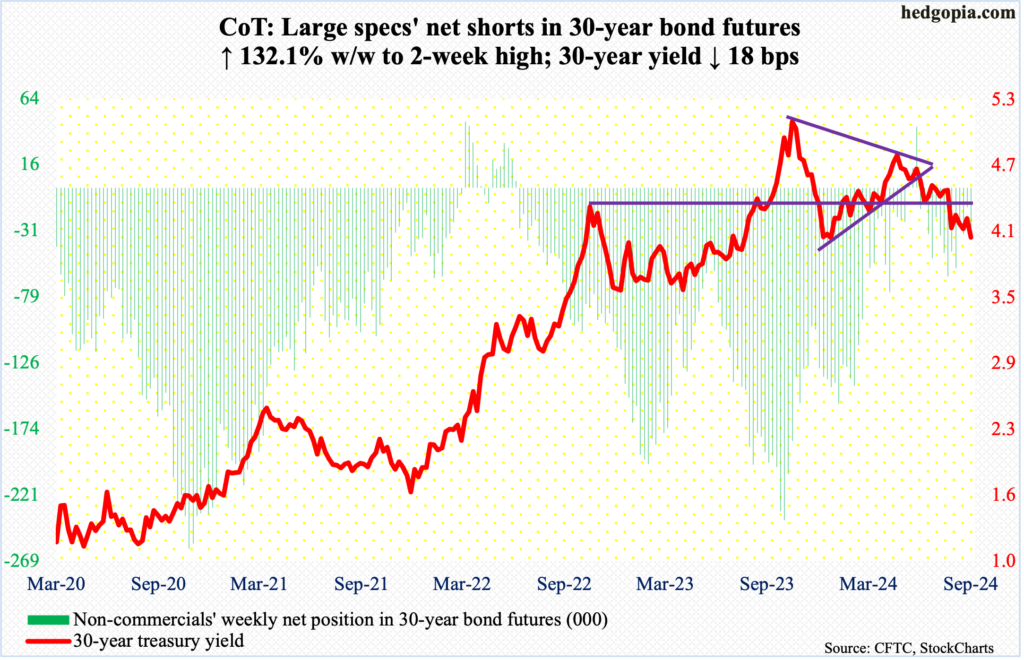
30-year bond: Currently net short 33k, up 18.8k.
Major US economic releases for next week are as follows.
The NFIB optimism index (August) is on schedule for Tuesday. Small-business optimism grew 2.2 points month-over-month in July to 93.7 – a 29-month high.
Wednesday brings the consumer price index (August). In the 12 months to July, headline and core CPI increased 2.9 percent and 3.2 percent, in that order. In 2022, they were growing at four-decade highs of 9.1 percent and 6.6 percent in June and September respectively.
The producer price index (August) is scheduled for release on Thursday. On a year-over-year basis, headline and core PPI rose 2.2 percent and 3.3 percent in July.
The University of Michigan’s consumer sentiment index (September, preliminary) is due out Friday. In August, consumer sentiment rose 1.5 points m/m to 67.9 – a two-month high. In March, sentiment hit a 32-month high 79.4.
WTI crude oil: Currently net long 156.6k, down 59.8k.
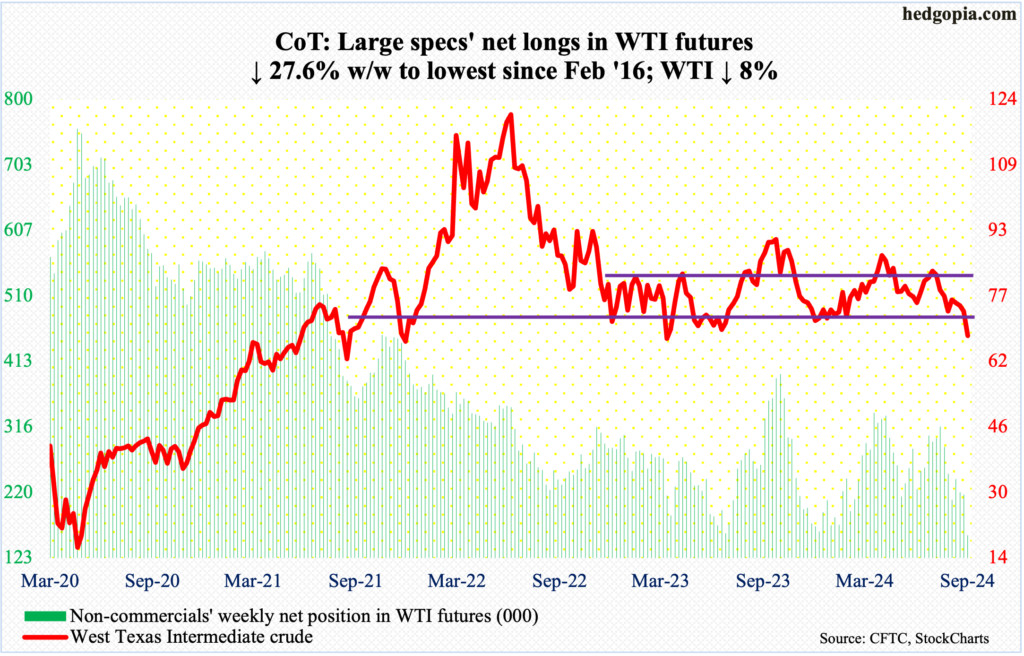
West Texas Intermediate crude tumbled eight percent this week to $67.67/barrel. This breaches a well-established range between $71-$72 and $81-$82 that persisted for years. Support at $71-$72, in fact, goes back nearly two decades.
The crude has made lower highs since reaching $95.03 last September. This week’s breakdown came even as OPEC+ put on hold a planned supply increase by two months. It was otherwise planning to raise output by 180,000 barrels per day from October.
Ahead, there is some support at $67. The daily is beginning to get oversold. WTI has been down four weeks in a row – and in eight of last nine. In due course, however, the May 2023 low of $63.57 has gained in significance.
In the meantime, US crude production in the week to August 30th was unchanged week-over-week at 13.3 million b/d. In two of the prior four weeks, output reached a record 13.4 mb/d. Crude imports declined 768,000 b/d to 5.8 mb/d. As did stocks of both crude and distillates, which respectively fell 6.9 million barrels and 371,000 barrels to 418.3 million barrels and 122.7 million barrels. Gasoline inventory, on the other hand, grew 848,000 barrels to 219.2 million barrels. Refinery utilization was unchanged at 93.3 percent.
E-mini S&P 500: Currently net short 48.8k, down 33.1k.
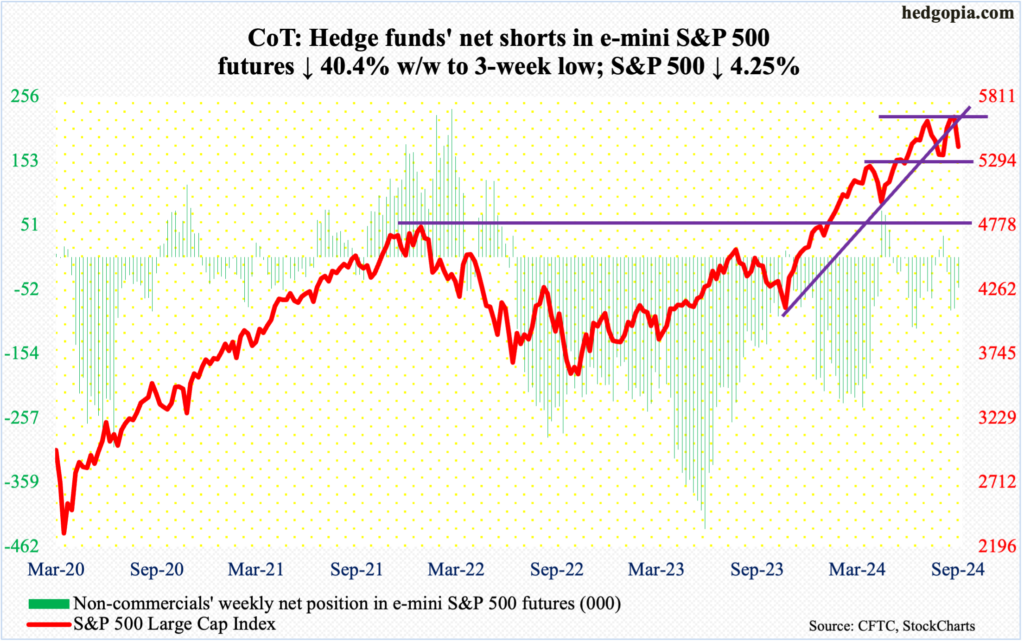
Equity bulls were unable to cash in on a breakout opportunity at 5640s, which is where the S&P 500 closed last week. Sellers, however, were in control this week – a holiday-shortened one – right from the get-go. The large cap index fell in all four sessions, with the bulls successfully defending the 50-day in the first three sessions but unable to mop up all the supply come Friday when the index gave back 1.7 percent, slashing through the average. For the week, it sank 4.3 percent to 5408.
The 200-day will not be tested until 5148. In the three-week July-August selloff, the S&P 500 bottomed at 5119, which was well above the average back then, as the 200-day is on an upward slope. The 50-day, however, is now flattish to slightly down, with risks rising it will begin to decidedly slope downward.
The weekly – let alone monthly – has a long way to go before the overbought condition it is in gets unwound. Immediately ahead, there is horizontal support at 5320s, and 5260s after that.
Euro: Currently net long 100k, up 7.2k.
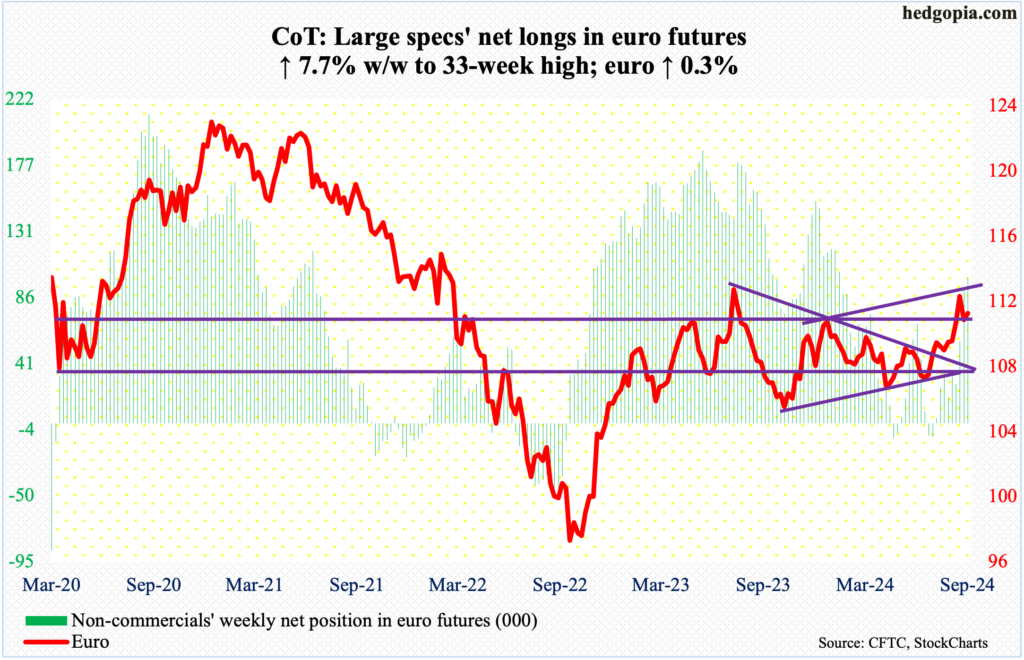
Non-commercials’ net longs in euro futures have risen to a 33-week high, even as the currency is giving out vibes it wants a lower print.
This week, the euro rose 0.3 percent to $1.1086 but was up as much as one percent at Friday’s high, which the bulls obviously were unable to hang on to.
That said, the euro remains above $1.10, which was recaptured three weeks ago. No sooner did that breakout occur than it was being retested, with the low this week of $1.1026. Odds favor a breach soon. At $1.07 lies channel as well as horizontal support.
Gold: Currently net long 287.6k, down 6.9k.
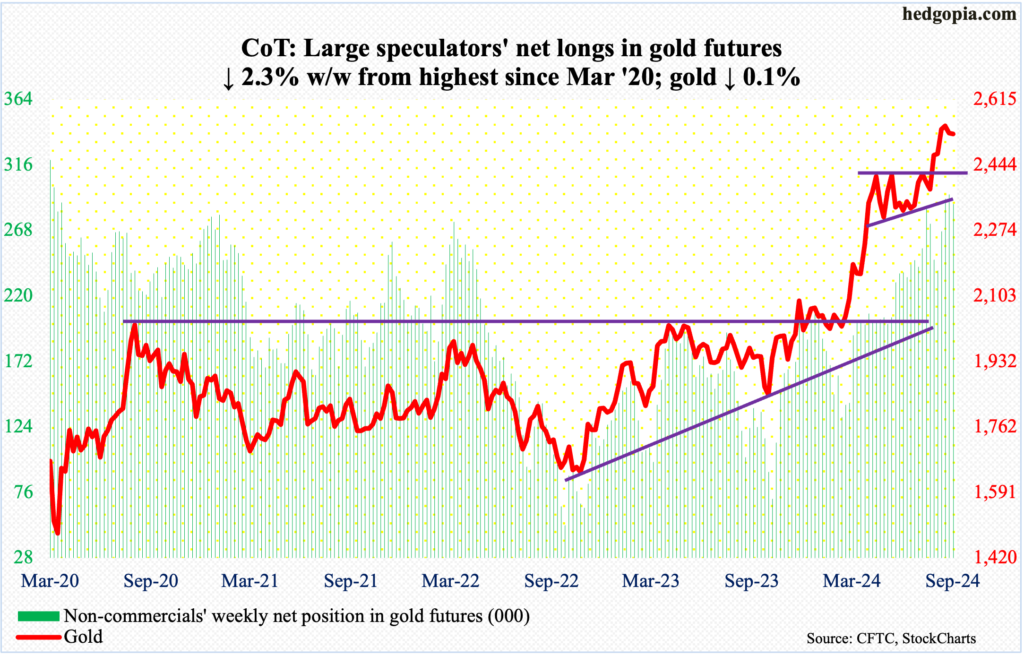
Gold bugs launched one more unsuccessful assault at $2,540s-50s. Rally attempts have stopped there since mid-August. Gold peaked at $2,570 on the 20th last month. This week, it edged lower 0.1 percent to $2,525/ounce.
The three weekly candles since that peak have all left large upper wicks. This preceded a sustained rally from $2,305 this June, including a breakout at $2,440s-50s after more than three months of sideways action. At some point, a retest of that breakout will be healthy.
Nasdaq (mini): Currently net long 26k, up 4.5k.
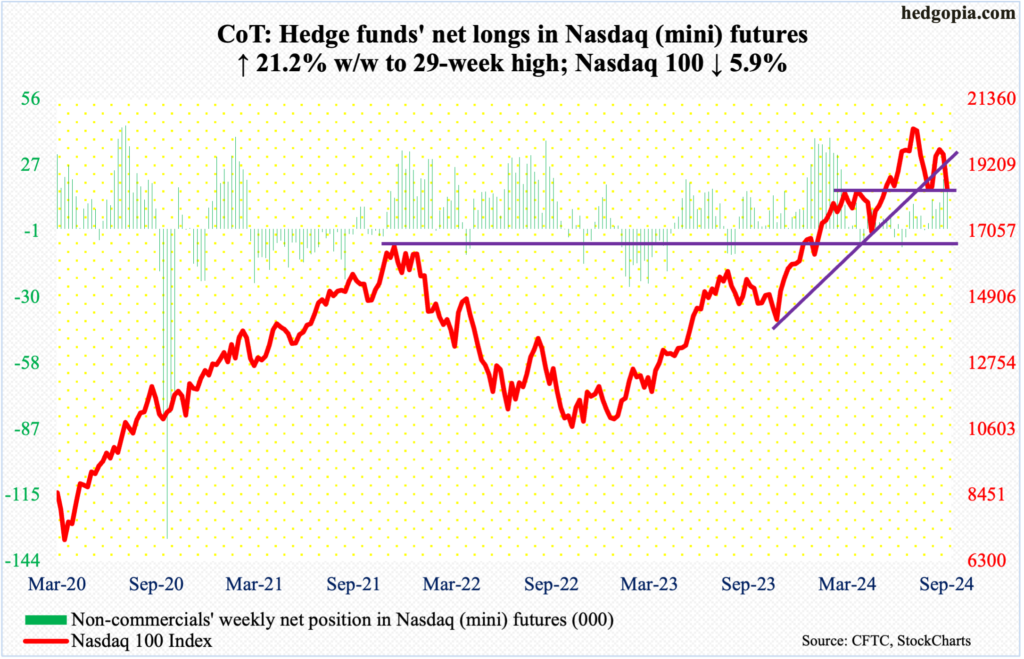
The Nasdaq 100 – a one-time high-flier – is genuinely taking it on the chin. It tumbled 5.9 percent this week to 18421 and is now down 11 percent from its July 10th record high of 20691. A lower high of 19939 was posted 11 sessions ago.
This week, the 50-day (19405) was decisively lost. The 200-day (18130) is less than 300 points away, and a test looks imminent. During the 19-session, peak-to-trough sell-off bottoming on August 5th, the 200-day was breached but only intraday. This time, tech bulls may not be so lucky.
Incidentally, the index closed this week right at 18420s horizontal support. The weekly is itching to go lower, so it is only a matter of time before this support gives way.
Russell 2000 mini-index: Currently net long 260, up 15.5k.
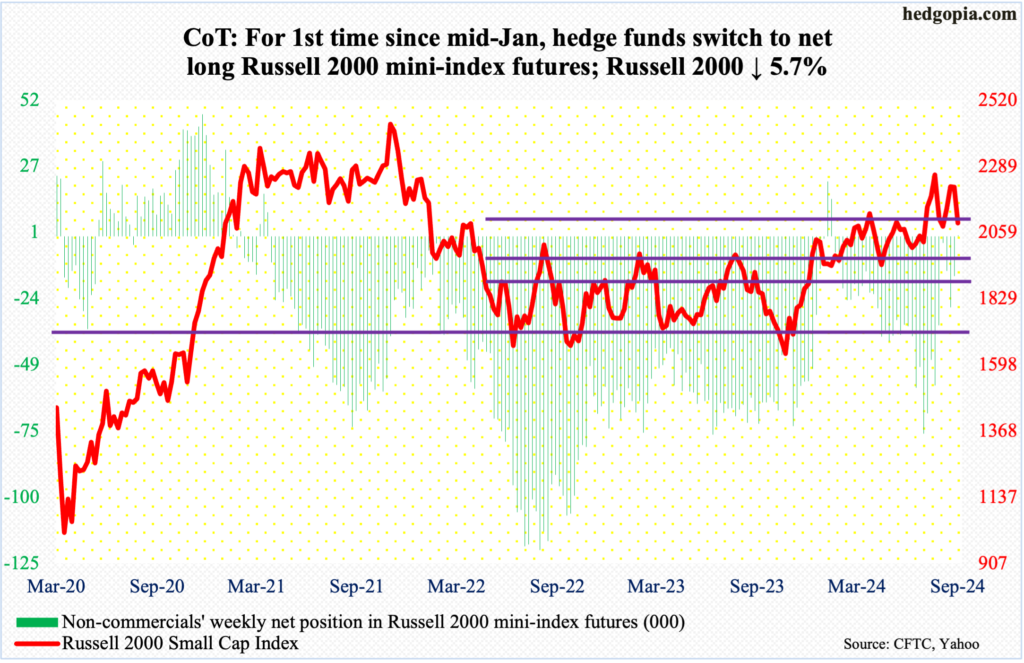
For the first time since mid-January this year, non-commercials are net long Russell 2000 mini-index futures. It has been quite a short-covering/squeeze. Early July, they were net short 75,435 contracts. This week (as of Tuesday, of course) they are net long 260. On July 2nd, the cash closed at 2034 and rallied all the way to 2300 by the 31st that month.
This squeeze tailwind is now gone for the bulls. The small cap index quickly dropped from 2300 to 1993 on August 5th, before rallying to 2238 by the 26th and is now back under 2100. This week, the Russell 2000 sank 5.7 percent to 2091.
For bulls and bears alike, 2100 has been an important level. The index has had trouble there going back to early March. At 2144 rests a 61.8-percent Fibonacci retracement of the drop between the November 2021 peak (2459) and the June 2022 trough (1641); 2100 also represents a measured-move price target post-breakout at 1900 last December, as the index was trapped between 1700 and 1900 going back to January 2022.
Bulls need to reclaim 2100 as soon as possible. Otherwise, shorts will be eyeing 2000, and 1900 in a worse-case scenario.
US Dollar Index: Currently net long 19.4k, up 516.
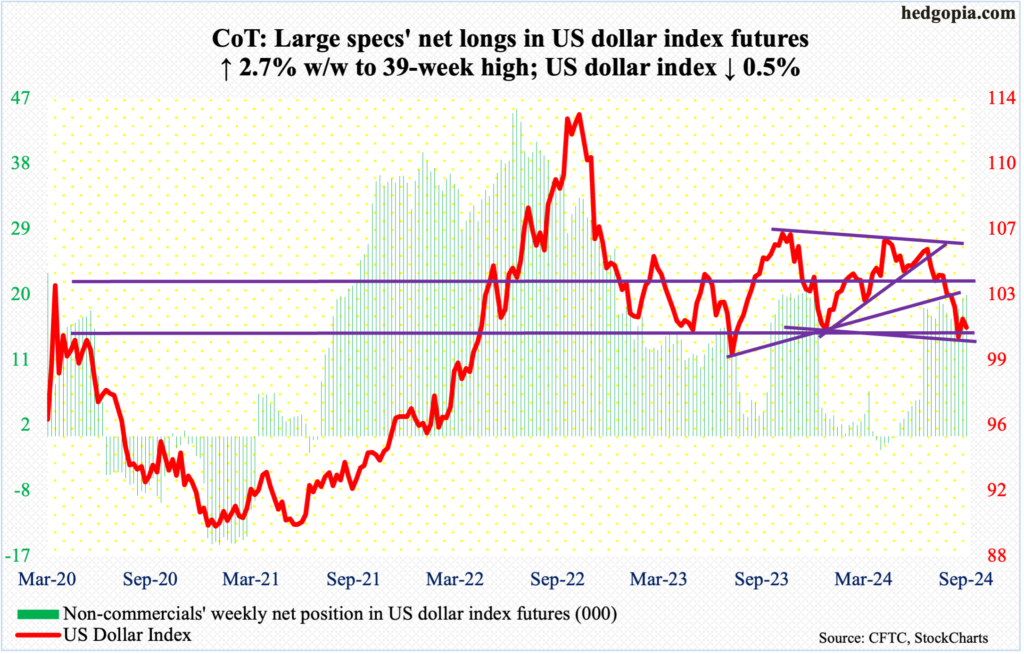
The US dollar index dropped 0.5 percent this week to 101.14 and could be ready to mount a rally.
This week’s low of 100.53 compares to last week’s 100.40 and 100.48 the week before. Horizontal support at 100-101 goes back years.
Earlier, 10 or 11 weeks ago, dollar bulls were denied at a falling trendline from last October when the index peaked at 107.05. Nine weeks ago, it fell out of a symmetrical triangle consisting of a rising trendline from last December when it bottomed at 100.32.
If a rally unfolds. the level to watch is 103-104, which goes back to December 2016. The support was lost early last month.
VIX: Currently net short 25.9k, down 4.6k.
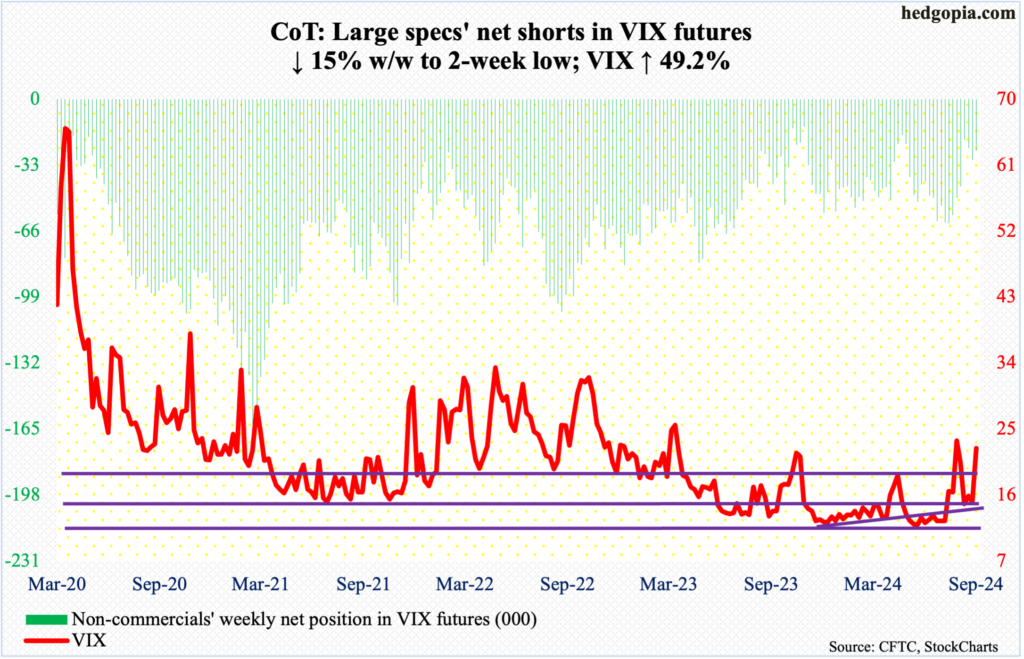
Last week, VIX closed between the 50- and 200-day, with the latter providing support for more than two weeks. This week, it shot up 7.38 points to 22.38.
Just ahead of VIX’s August 5th spike reversal tagging 65.73 intraday, the weekly RSI rallied to low-70s before coming under pressure. The metric went sideways at the median for a few weeks, lifting off this week to 62-plus. This is a positive sign for volatility bulls.
Thanks for reading!
More By This Author:
Hedge Funds Positions, Noncommercial Buying - How CoT Peeks Into The Future
Easing Cycle Set To Begin Next Month; Historically, Equities React By Declining
CoT: Peer Into Future Through Futures, How Hedge Funds Are Positioned


Comments
Log in or sign up to join the conversation.