
Following futures positions of non-commercials are as of August 20, 2024.
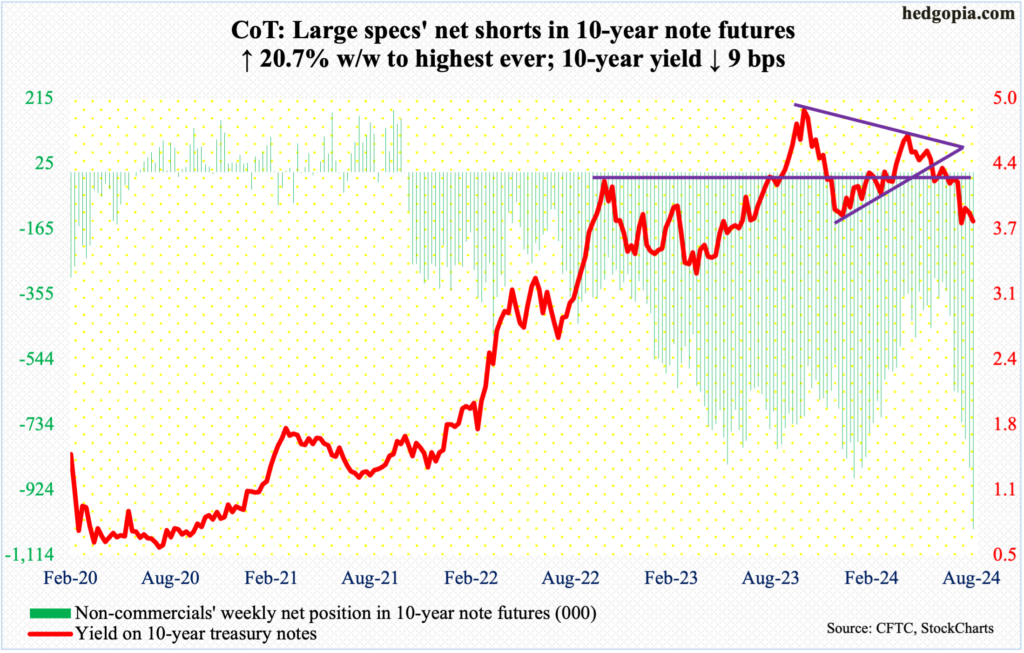
10-year note: Currently net short 1.04mn, up 177.9k.
“The time has come for policy to adjust.” The quote is from Jerome Powell, Federal Reserve chair, in his keynote address Friday at the annual Jackson Hole Symposium. That sentence pretty much sums up the gist of his speech. Not that this came out of the blue.
In fact, last month’s FOMC meeting dropped enough hints for markets to comfortably price in a 25-basis-point cut in next month’s meeting, slated for 17-18. In the wake of Powell’s speech, fed funds futures traders are sticking with that outlook. In the remaining two meetings after September’s – November (6-7) and December (17-18) – they continue to expect combined cuts of 75 basis points. More interestingly, they have their money on four to five more 25-basis-point cuts next year, ending 2025 at 325 basis points to 350 basis points. That is a reduction of two percentage points from where rates are currently.
Since July last year, the fed funds rate has been left unchanged at a range of 525 basis points to 550 basis points. Earlier, the central bank began to tighten from zero to 25 basis points in March 2022. Now that Powell has given the green light that an easing cycle will get underway in September, how far it goes – both in duration and quantity – remains to be seen. Futures traders are very optimistic, which by default also suggests they expect the economy to soften quite a bit from here.
Non-commercials, however, have other ideas. They just raised their holdings of net shorts in 10-year-note futures to a fresh record, betting on higher rates on the long end of the yield curve.
The 10-year treasury yield bottomed at 3.67 percent on the 5th, having peaked last October at five percent. On Friday, these notes responded to the Powell speech by shedding six basis points to 3.81 percent. Near-term, the low early this month can get tested but it is unlikely it gets breached. In a perfect scenario for bond bears (on price), the 10-year can rally to 4.2 percent and then face massive resistance. If this scenario pans out, this will be an opportunity for non-commercials to reduce/exit their positions. If they overstay their welcome, squeeze risks go up meaningfully.
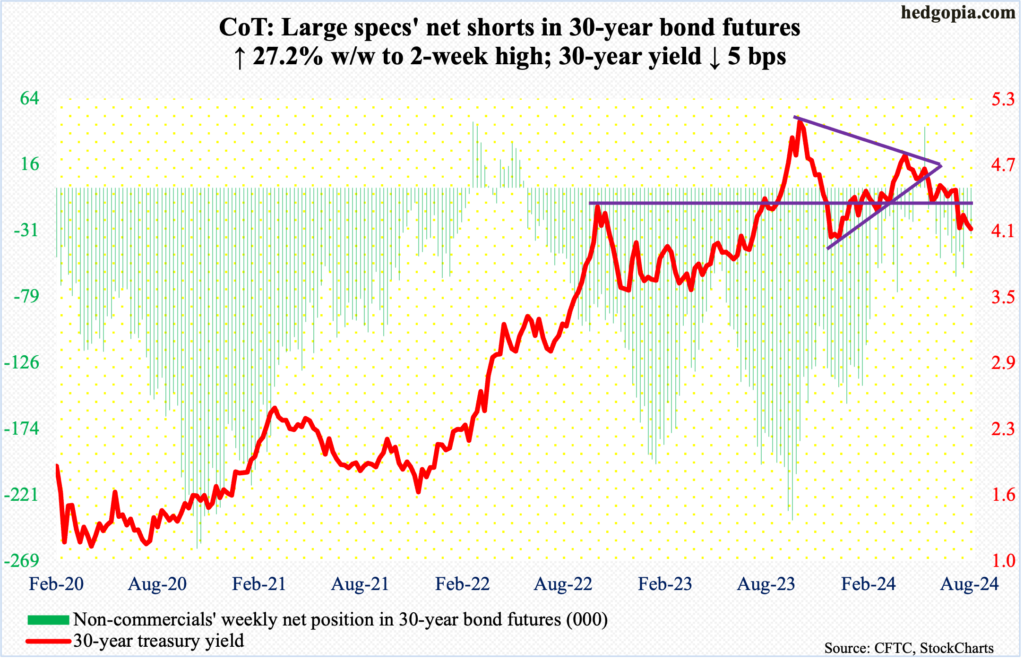
30-year bond: Currently net short 33.5k, up 7.2k.
Major US economic releases for next week are as follows.
Durable goods orders (July) are scheduled for release on Monday. June orders for non-defense capital goods ex-aircraft – proxy for business capex plans – increased 0.9 percent month-over-month to a seasonally adjusted annual rate of $73.9 billion. A record $74 billion was registered last December.
The S&P Case-Shiller home price index (June) is due out Tuesday. Nationally, home prices rose 5.9 percent year-over-year in May, which is the third consecutive month of deceleration in home price appreciation, having risen at 6.5 percent in February.
Thursday brings GDP (2Q24, 1st revision) and corporate profits (2Q24, preliminary).
The first print showed real GDP grew at an annual rate of 2.8 percent in the June quarter. This was the eighth consecutive quarterly expansion after back-to-back contraction in the first and second quarters of 2022.
In 1Q24, corporate profits with inventory valuation and capital consumption adjustments fell 1.4 percent to $3.37 trillion (SAAR) from the prior quarter’s record $3.41 trillion.
Personal income/spending (July) and the University of Michigan’s consumer sentiment index (August, final) will be released Friday.
In the 12 months to June, headline and core PCE (personal consumption expenditures) rose 2.5 percent and 2.6 percent respectively. In June and February of 2022, they were growing at four-decade highs of 7.1 percent and 5.6 percent, in that order.
August’s preliminary reading showed consumer sentiment increased 1.4 points m/m to 67.8 – a two-month high. March’s 79.4 was the highest since July 2021.
WTI crude oil: Currently net long 220.1k, down 19.5k.
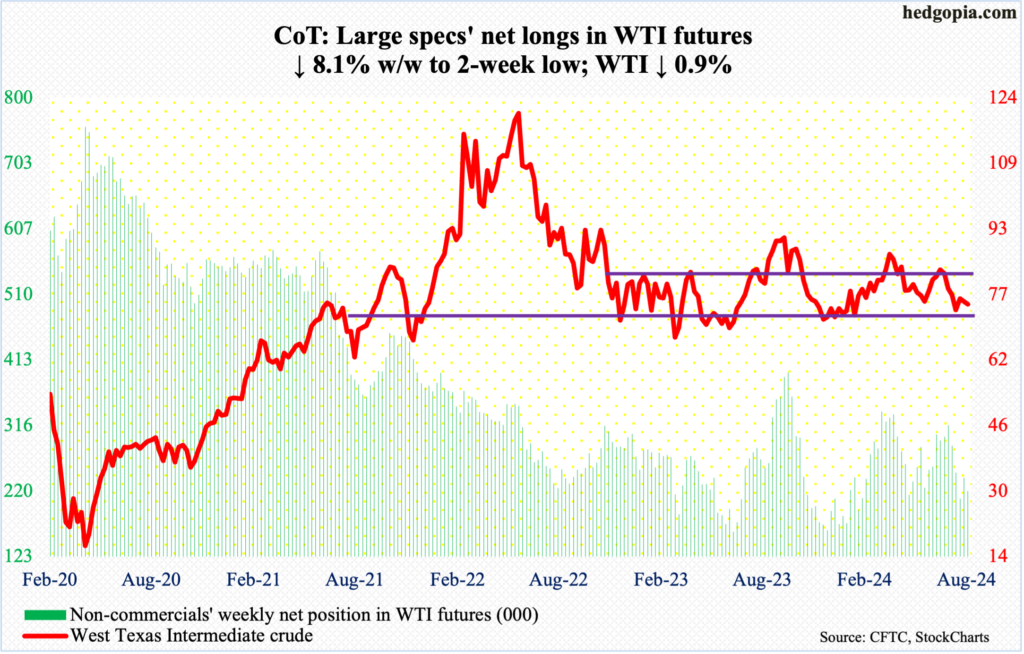
Range traders are having a field day. For months, West Texas Intermediate crude has been rangebound between $71-$72 and $81-$82. It just bounced off the bottom of that range.
Most recently, on the 5th this month, WTI bottomed at $71.67 intraday. A week later – on the 12th – it hit $80.16 and headed lower. This Wednesday, the crude ticked $71.46 intraday, followed by Thursday’s $71.58, which was bought, closing the session up 1.5 percent to $73.01. Come Friday, it rallied another 2.5 percent to $74.83/barrel.
Incidentally, a rising trendline from May last year when WTI bottomed at $63.57 was tested this week and remains intact. Above, trendline resistance from last September lies around $82, which approximates the top of the range discussed earlier.
The path of least resistance is up.
In the meantime, US crude production in the week to August 16th increased 100,000 barrels per day week-over-week to match record output of 14.4 million b/d set two weeks ago. Crude imports increased 367,000 b/d to 6.7 mb/d. Stocks of crude, gasoline, and distillates all declined – down respectively 4.6 million barrels, 1.6 million barrels and 3.3 million barrels to 426 million barrels, 220.6 million barrels and 122.8 million barrels. Refinery utilization rose eight-tenths of a percentage point to 92.3 percent.
E-mini S&P 500: Currently net short 84.8k, up 61.4k.
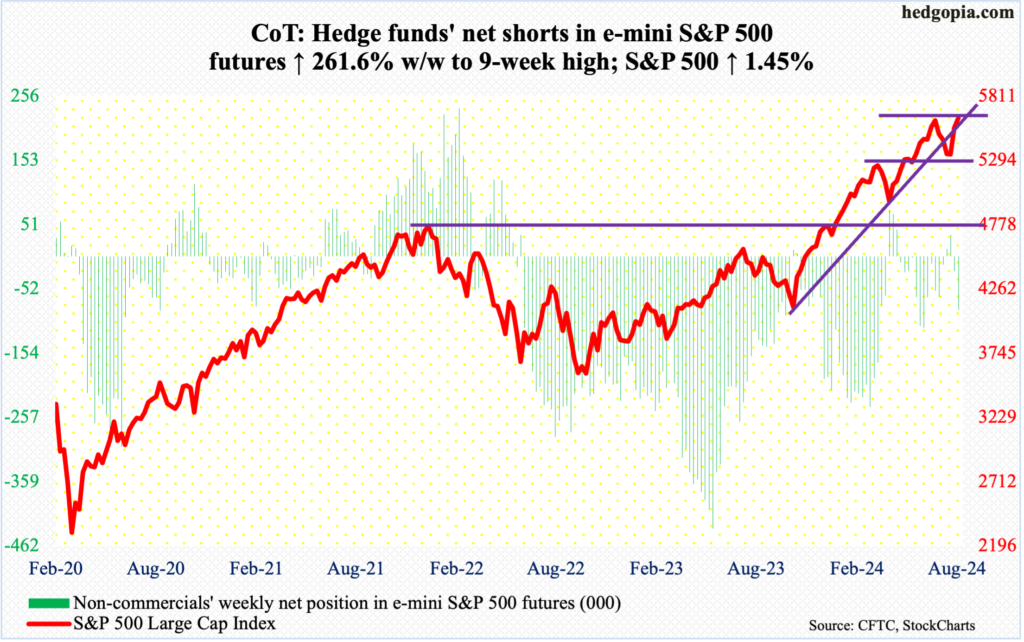
Things could not go any better for equity bulls.
From the July 16th high to the August 5th low, the S&P 500 gave back 9.7 percent. From that low through Friday’s close (5635), it has now rallied 10.1 percent, closing the July 17th gap at 5630s. With this, the large cap index is merely 35 points from the July 16th record of 5670.
Odds favor that the bulls will manage to post a new high as soon as next week. Concurrently, it is unlikely it gets much traction after that. Among others, momentum is a question mark, with the daily RSI struggling at low-60s, even as the index is within reach of a new high. Six weeks ago, when the S&P 500 was in the process of peaking at 5670, the RSI stayed north of 70 throughout the first half of July, even hitting low-80s at one point.
Euro: Currently net long 56k, up 29k.
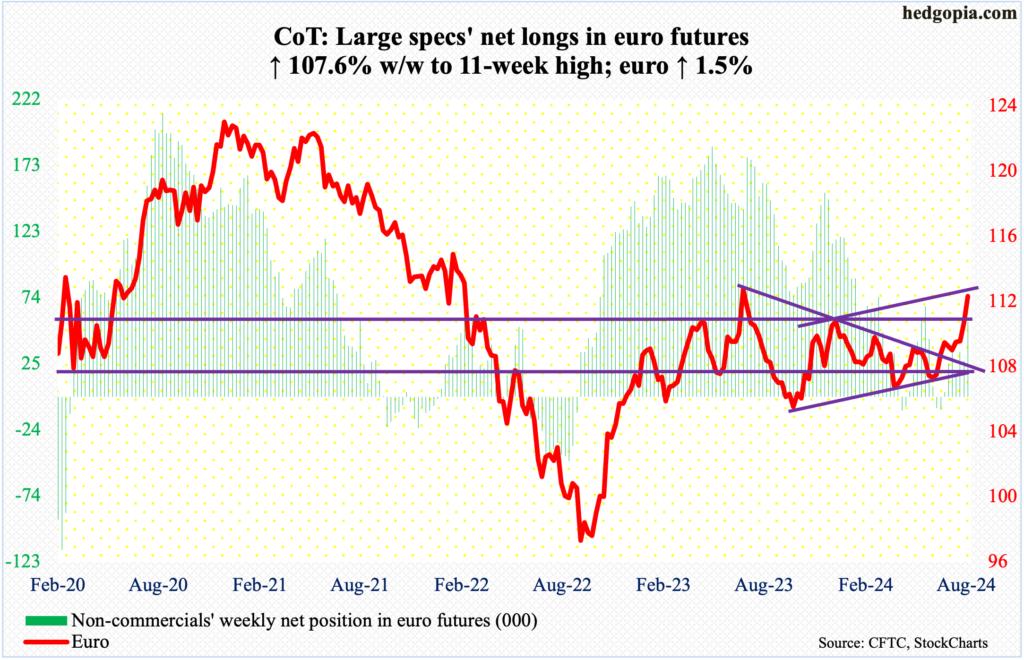
The euro enjoyed its fourth consecutive up week, rallying 1.5 percent to $1.1193, helped along by Friday’s – thanks to Powell – 0.7-percent rise.
This week’s gains follow last week’s break out of a symmetrical triangle – made up of an upper trendline that goes back to July last year when the euro topped at $1.128 and a lower trendline from last October when it bottomed at $1.045.
Euro bulls this week also took care of $1.10, which they had been unable to sustainably reclaim since February last year. This is the level to watch when the next round of downside pressure begins.
On the daily, the euro is beginning to look stretched. It also faces channel resistance.
Gold: Currently net long 291.3k, up 24k.
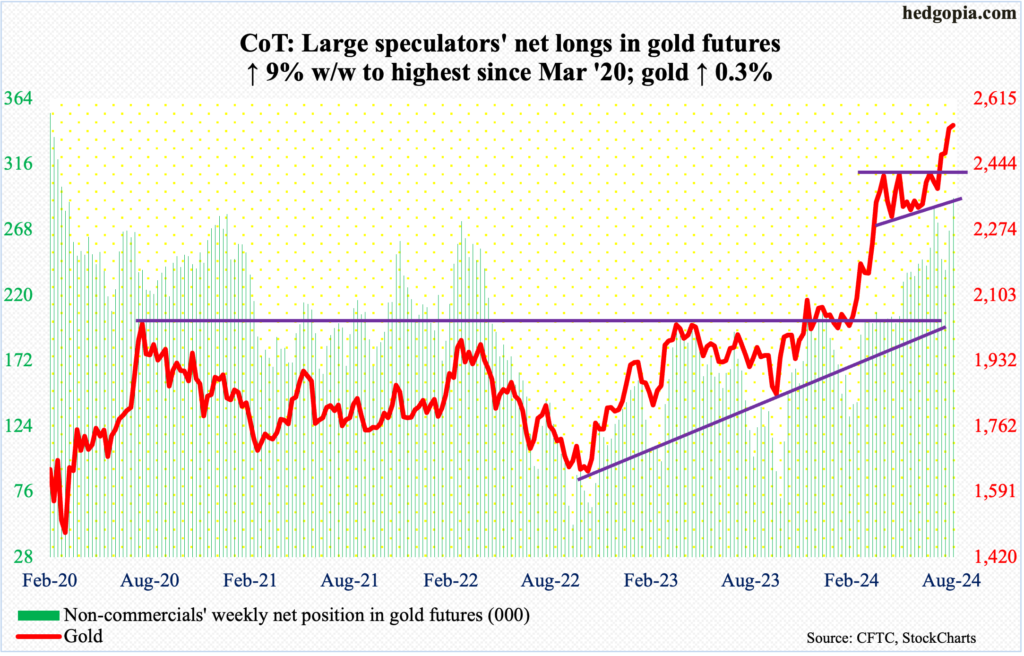
Gold trudged higher to yet another record in a spinning top week. The metal rose 0.3 percent to $2,546/ounce, with an intraday high of $2,570 on the 20th.
The yellow metal has gone sideways at $2,540s-50s the last six sessions. A possible breakout in the sessions ahead will open the door toward this week’s high, and that will decide which way gold goes near-term.
Earlier, the metal went sideways at $2,440s-50s for more than three months before breaking out early this month. Gold bugs should be fine as long as this breakout remains intact.
In the meantime, non-commercials are net long gold futures the most since March 2020.
Nasdaq (mini): Currently net long 11.4k, up 2.9k.
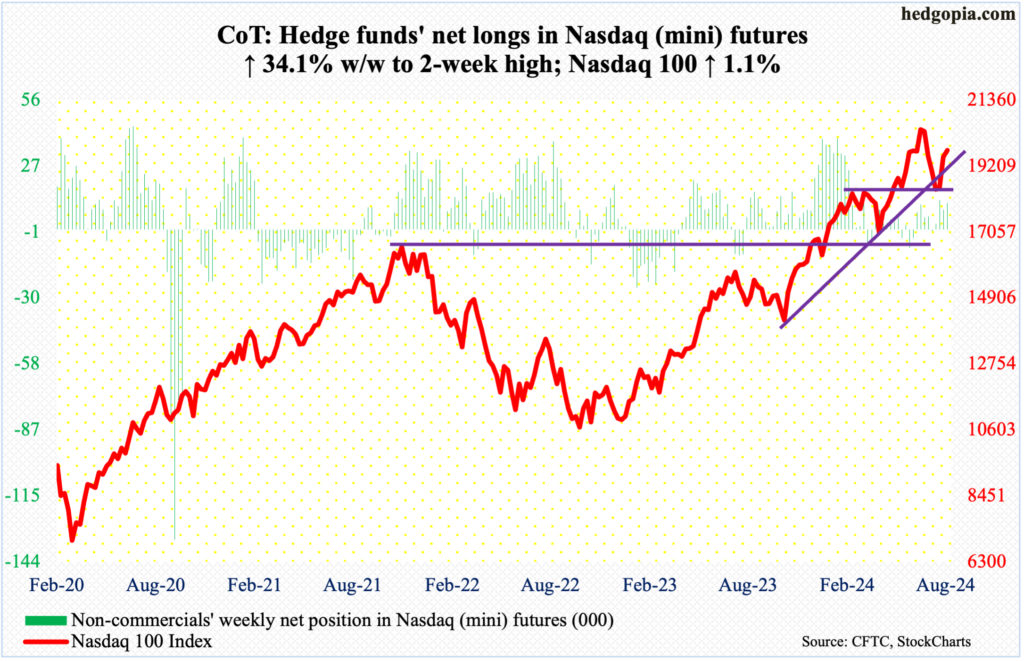
Tech is not giving out good vibes.
This week, the Nasdaq 100 rallied 1.1 percent to 19721 but was up as much as 2.2 percent at Thursday’s high, when it reversed sharply lower to form a bearish engulfing candle, followed by Friday’s spinning top. This took place just above the 50-day (19502), with the index above the average the last seven sessions.
As things stand, tech bears are likely to get aggressive should the Nasdaq 100 manage to fill a July 17th gap at 20200s.
Russell 2000 mini-index: Currently net short 27.1k, up 13.9k.
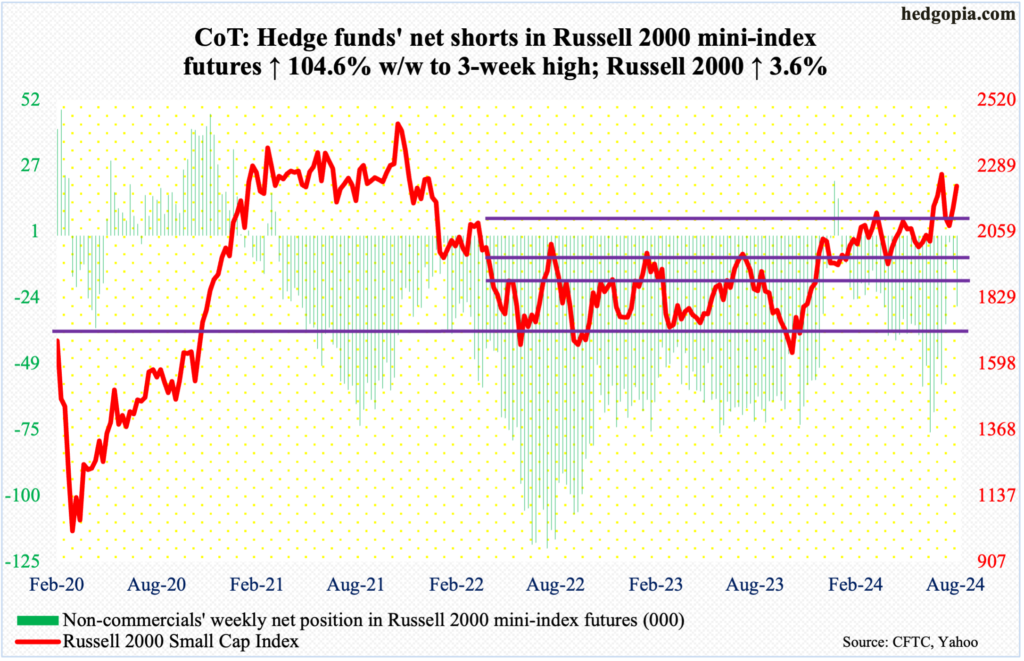
The Russell 2000 had a strong week – up 3.6 percent to 2219 – but nearly all of it came on Friday when the small cap index rallied 3.2 percent on the back of Powell’s dovish comments.
That said, the Russell 2000 has already been pricing in lower rates. It broke out of 2100 on July 11th, reacting favorably to softer-than-expected CPI reading for June. This has been an important level for bulls and bears alike. After that, on July 31st, within merely 15 sessions of the 2100 breakout, the Russell 2000 added another 200 points and retreated after ticking 2300 intraday.
The index has had trouble at 2100 going back to early March. To boot, 2144 represents a 61.8-percent Fibonacci retracement of the drop between the November 2021 peak (2459) and the June 2022 trough (1641); 2100 also represents a measured-move price target post-breakout at 1900 last December, as the index was trapped between 1700 and 1900 going back to January 2022.
In the second half last month, there were several unsuccessful attempts at 2260s, and this is the one to watch in the event of further push higher.
US Dollar Index: Currently net long 17.6k, down 945.
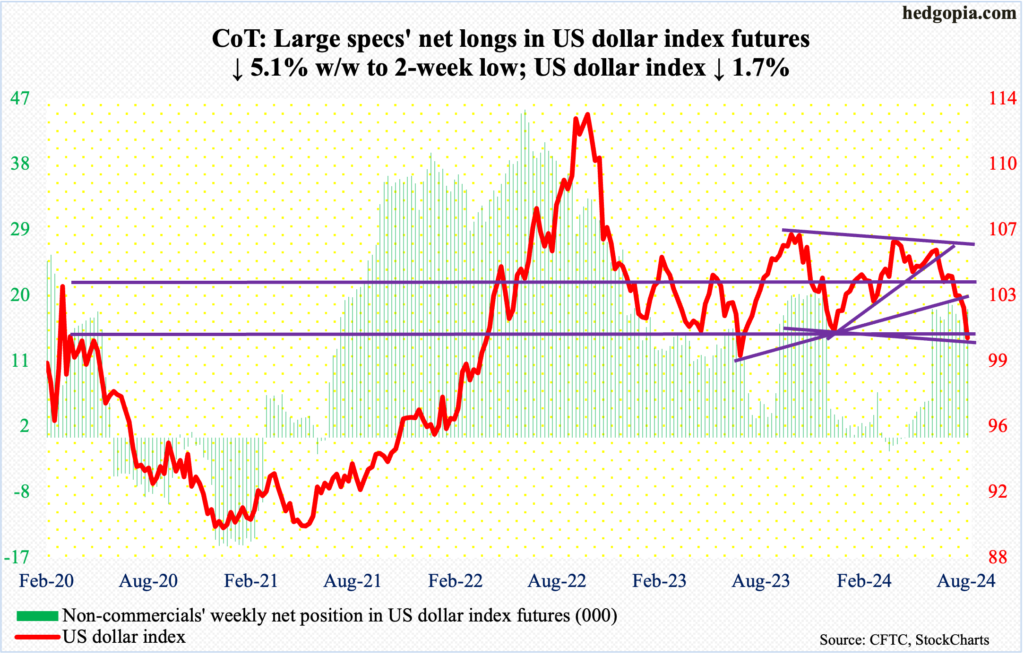
After five straight weekly declines – and seven out of eight – the US dollar index once again sits on potentially important support. This week, it fell 1.7 percent to 100.61. Support at 100-101 goes back years.
Previously, eight-nine weeks ago, dollar bulls were denied at a falling trendline from last October when it peaked at 107.05. Seven weeks ago, the index fell out of a symmetrical triangle consisting of a rising trendline from last December when it bottomed at 100.32. This week, it breached trendline support from July last year when it bottomed at 99.22.
There have been too many breaches of late, thus the significance of horizontal support at 100-101.
VIX: Currently net short 24.6k, up 4.3k.
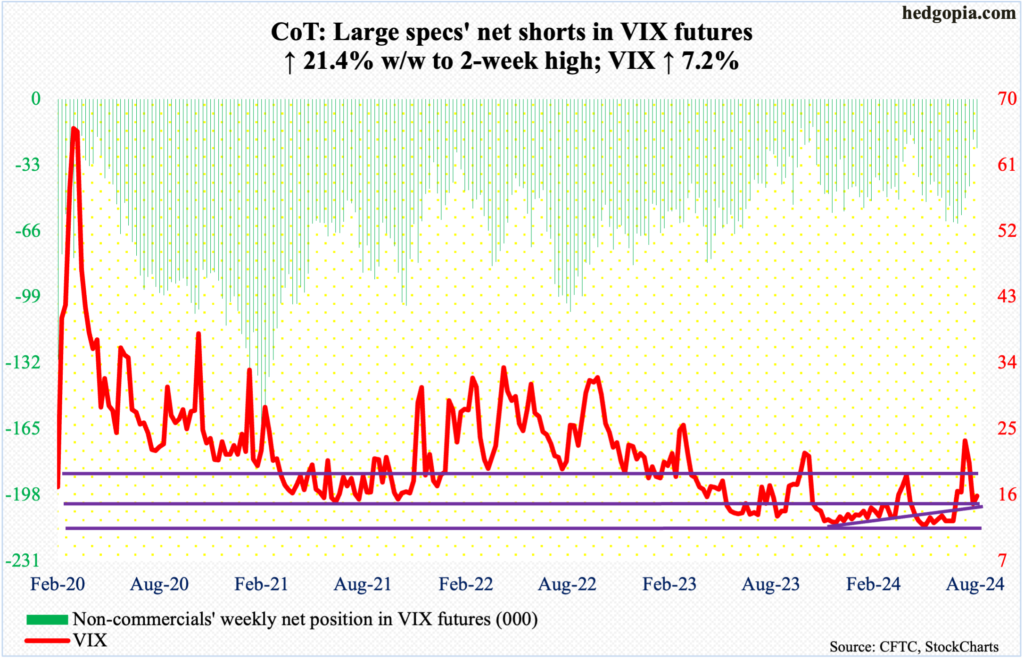
In one of those rare weeks in which both the S&P 500 and VIX rallied, the volatility index added 1.06 points this week to 15.86. The daily looks like it wants to go higher.
After two tough weeks during which VIX went from 65-plus to sub-15, a long-legged doji formed this week on the weekly.
Volatility bulls defended the 200-day (14.36) for four sessions before they went after the 50-day (16.07), with VIX above the latter on Wednesday and Thursday before losing it on Friday. From their perspective, a decisive breach of the 200-day could have opened the door toward 11-12, which is where it persistently found support for months, and that has been averted.
Amidst this, the options market is reflecting a lot of optimism. In six of the last seven sessions, the CBOE equity-only put-to-call ratio came in at 0.50s or lower, with Monday registering 0.47, which was the lowest since July 11th last year.
Thanks for reading!
More By This Author:
It Is Understandable Why Russell 2000 Remains Under Its Nov ’21 Record High
Projecting Futures Via the CoT Report - Eye On Noncommercials
Fed Should Just Say No To Fed Put


Comments
Log in or sign up to join the conversation.