
With mixed macro messages, small-caps, which tend to have high domestic economic exposure, struggle to gain traction. The Russell 2000 remains under its November 2021 high. The sell-side is very optimistic about next year’s earnings, but it is prudent to fade that optimism.
Traders are probably having a field day, thanks to the prevailing volatility – perceived or actual – in macro data. The addition of 114,000 non-farm jobs in July – lower than expected – set off a sharp, but quick, selloff in equities. Until then, markets cherished bad data, hoping for aggressive easing by the Federal Reserve. But the jobs report was perceived as raising recession risks, which panicky markets took more seriously than the associated increased prospects for rate cuts.
Last week’s CPI and PPI for July confirmed the ongoing disinflation trend, putting the focus back on rate cuts, with the discussion not on if the Fed would ease but how aggressively. Traders are also struggling with the weekly unemployment claims, which are cold one week and hot the next. Thursday’s retail sales further added fuel to the ‘growth is intact’ narrative.
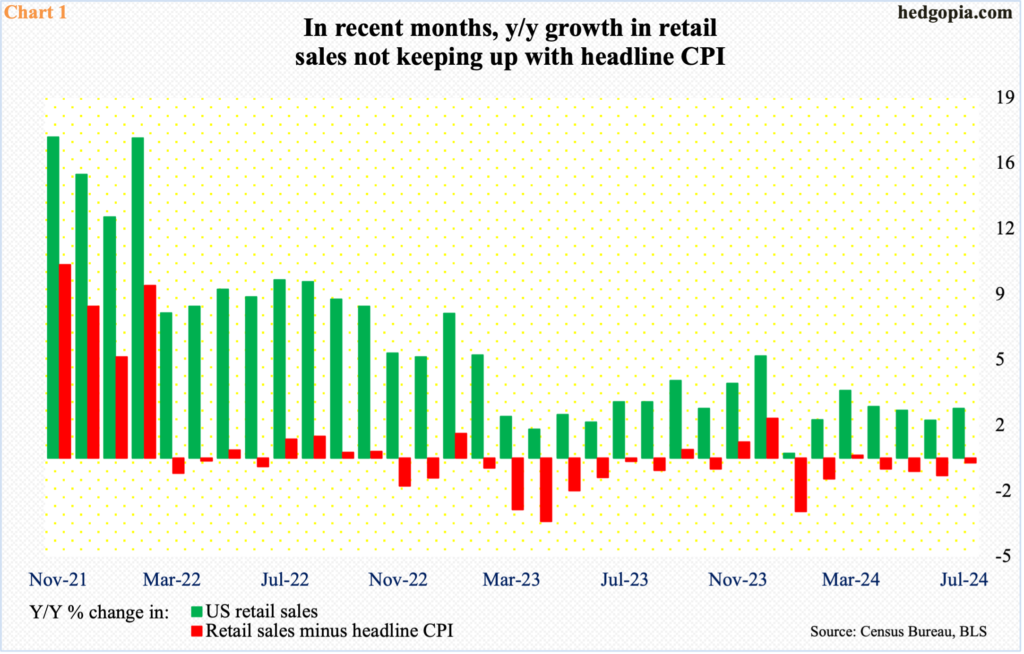
Speaking of which, retail sales jumped one percent month-over-month in July to a seasonally adjusted annual rate of $709.7 billion – a fresh record. This was the fastest growth rate since January 2023. But monthly data are volatile. From a year ago, July sales were up 2.7 percent; two years ago, year-over-year growth was north of nine percent.
More importantly, adjusted for inflation, retail sales have contracted in recent months. This, in fact, has happened in 16 of the last 21 months, including the last four in a row (Chart 1).
Amidst all this, small-caps, which inherently have higher domestic exposure than their larger-cap cousins, continue to battle conflicting messages from the economy. They rally on better prospects for rate cuts by virtue of well-behaving inflation, but struggle as the debate shifts to faster-than-expected economic deceleration.
The Russell 2000 (2142) remains under its November 2021 record of 2459. Back then, the Nasdaq 100 peaked in that same month at 16765 and surpassed that high last December, before going on to print 20691 last month. The S&P 500 similarly peaked at 4819 in January 2022, went past that high two years later and reached a new high of 5670 last month.
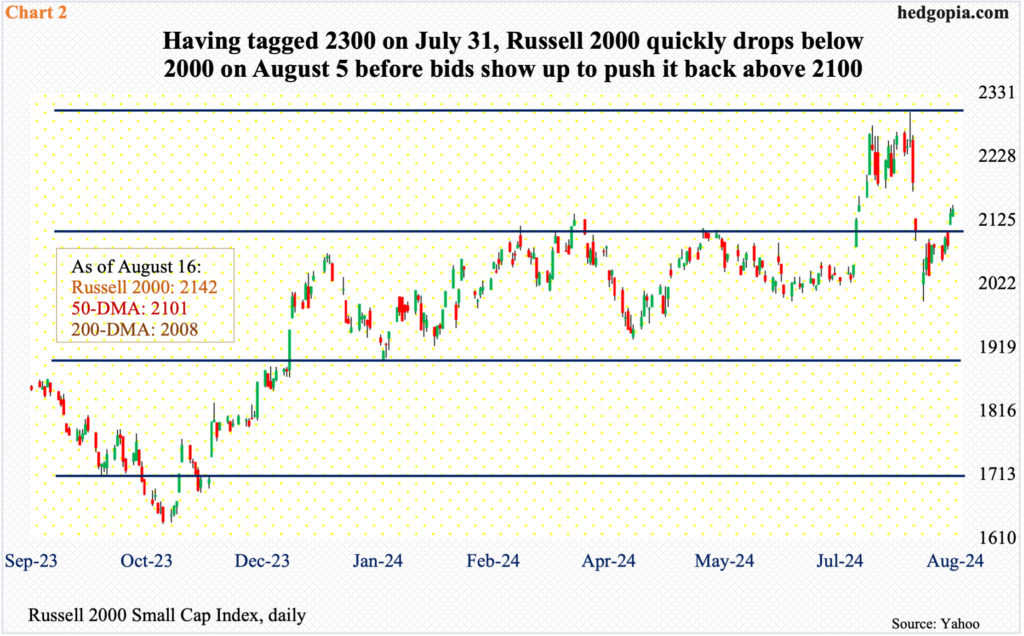
The Russell 2000’s inability to post a new high is emblematic of persistent mixed macro messages. Having bottomed at 1640s in June and October of 2022 and again last October, the small cap index broke out of 2100 on July 11th when it reacted favorably to a softer-than-expected CPI reading for June. This has been an important level for bulls and bears alike.
The Russell 2000 has had trouble at 2100 going back to early March. Further, 2144 represents a 61.8-percent Fibonacci retracement of the drop between the November 2021 peak and the June 2022 trough (1641); 2100 also represents a measured-move price target post-breakout at 1900 last December, as the index was trapped between 1700 and 1900 going back to January 2022.
On July 31st, within merely 15 sessions of the 2100 breakout, the Russell 2000 added another 200 points and retreated after ticking 2300 intraday (Chart 2). After that, it went just below 2000 on the 5th this month but managed to rally back above 2100 last week.
As things stand, the Russell 2000 remains in no-man’s land. In the second half last month, there were several unsuccessful attempts at 2260s and this is the one to watch in the event of a rally.
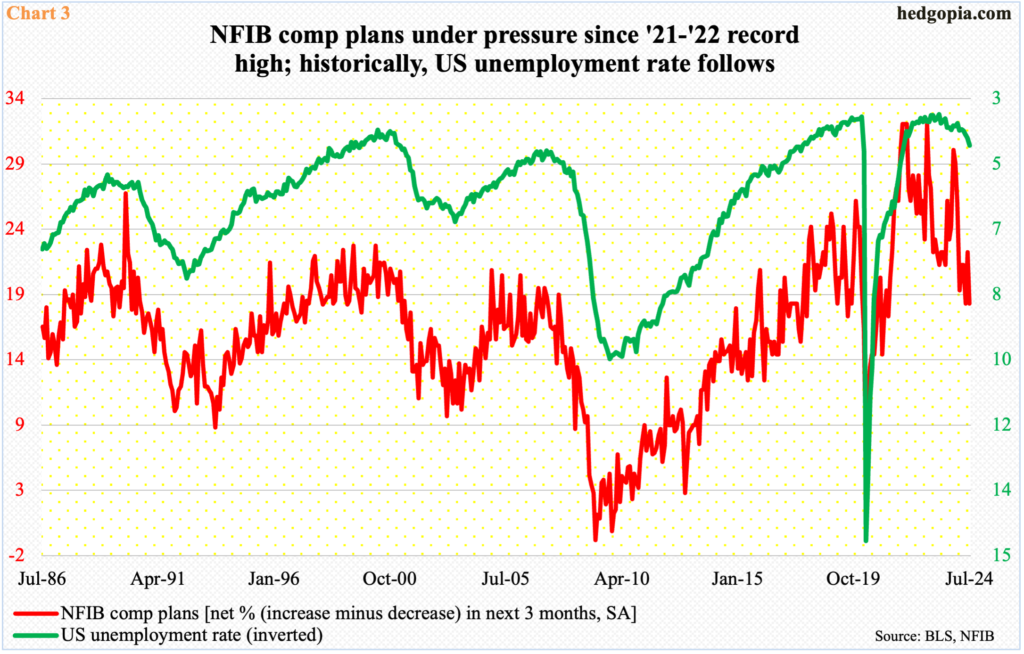
One of the places investors are taking a cue from is the NFIB optimism index, which rose 2.2 points month-over-month in June to 93.7 – a 29-month high. As recently as March, small-business optimism was at 88.5, which was the lowest reading since December 2012.
Within the index, the compensation plans sub-index declined four points m/m in July to 18, which has not been this low since March 2021; in October-December 2021 and again in October 2022, it peaked at 32 four times before heading lower. If past is prelude, the unemployment rate follows (Chart 3).
In July, the unemployment rate increased 20 basis points m/m to 4.25 percent. The trend is up. In April last year, it dipped to 3.43 percent, which was a 54-year low.
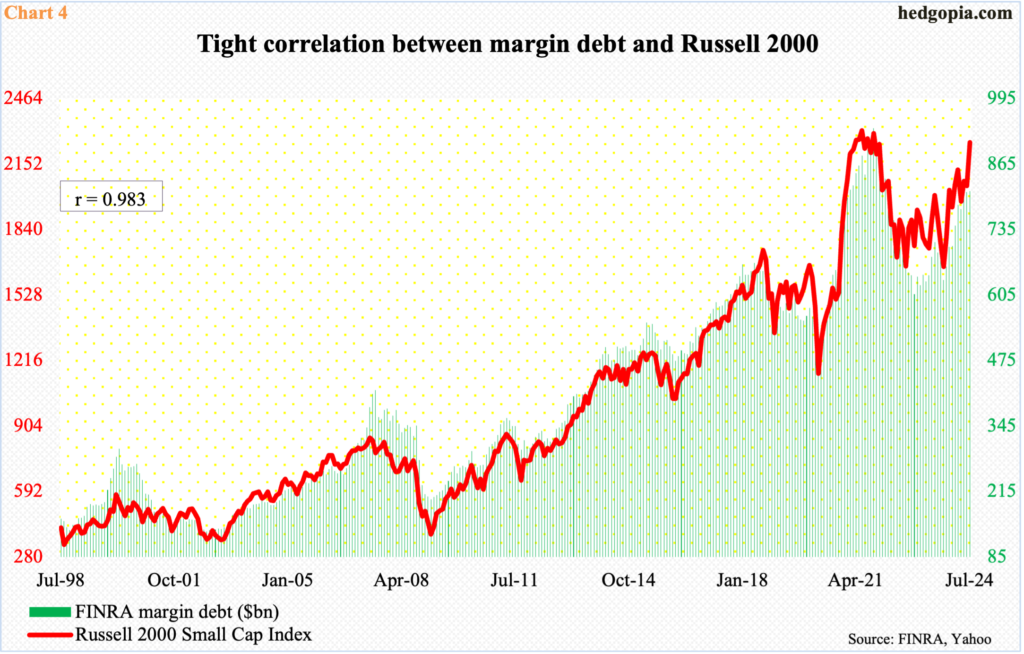
Historically, FINRA margin debt has a tight correlation with the Russell 2000 (Chart 4) – more so than with either the S&P 500 or the Nasdaq 100.
Margin debt reached a new all-time high of $935.9 billion in October 2021 – a month ahead of the peak in the Russell 2000. In December 2022, margin debt bottomed at $606.7 billion and then again last October at $635.3 billion. In July, it hit $810.8 billion. That said, it has essentially gone sideways the last three months – $809.4 billion in May and $809.3 billion in June.
The Russell 2000 closed May at 2070 and July at 2254, with an intraday high of 2300. Yet, this did not materialize on the back of leverage. Longs are no longer willing to take on margin debt.
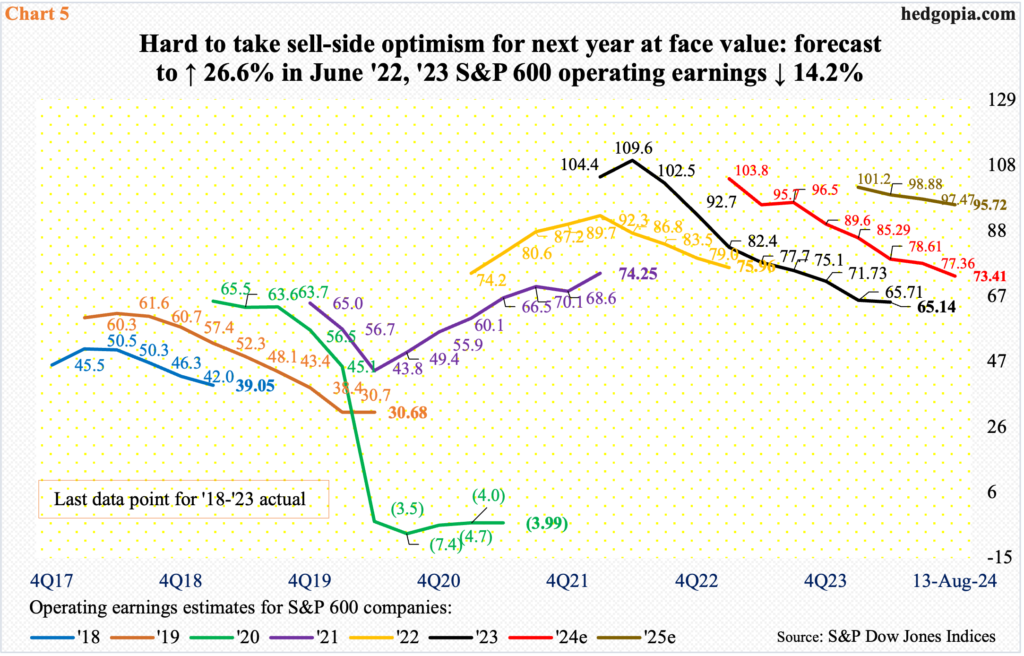
The sell-side remains bullish on next year’s earnings, but it is hard to take their optimism at face value. These analysts have a habit of starting out optimistic and then take out a pair of scissors as the year progresses (Chart 5).
Consensus 2022 operating earnings estimates for S&P 600 companies stood at $92.70 in April that year; when it was all said and done, these companies brought home $75.96, up 2.3 percent for the year. For 2023, the sell-side modeled in $111.23 in June 2022; in the end, earnings came in at $65.14, down 14.2 percent. For 2024, in March last year, estimates were $105.68, which, with two quarters of actual numbers, has now been revised lower to $73.41. Optimism for 2025, once again, is high – was $102.88 in May this year and $95.72 as of last Tuesday, which if hit ensures 30.4 percent growth! It is prudent to fade the optimism, and this is getting reflected in the Russell 2000.
More By This Author:
Projecting Futures Via the CoT Report - Eye On Noncommercials
Fed Should Just Say No To Fed Put
Mining The Latest CoT Report For The Movements of Noncommercials, Hedge Funds, Futures


Comments
Log in or sign up to join the conversation.