
Elliott Wave Technical Analysis: Twist Bioscience Corp.

Photo by Austin Distel on Unsplash
Twist Bioscience Corp., Elliott Wave Technical Analysis
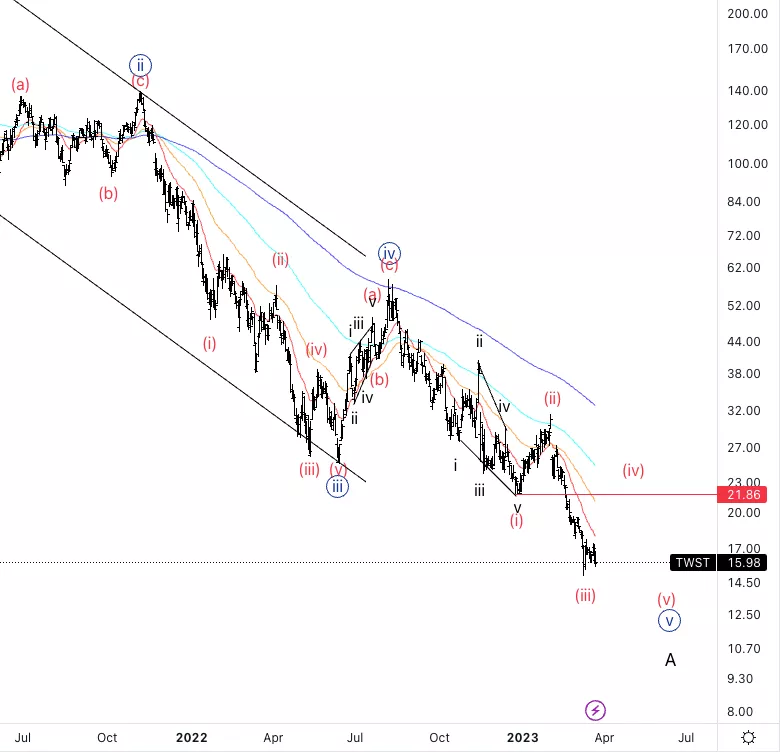
Twist Bioscience Corp., (Nasdaq: TWST): Daily Chart, 24 March 2023.
TWST Stock Market Analysis: Looking for further downside as we have an incomplete bearish sequence. Looking for a pullback in wave (iv) to then resume lower.
TWST Elliott Wave Count: Wave (iii) of (v).
TWST Technical Indicators: Below all averages.
TWST Trading Strategy: Looking for further downside with an invalidation level at 21.8$.
Analyst: Alessio Barretta
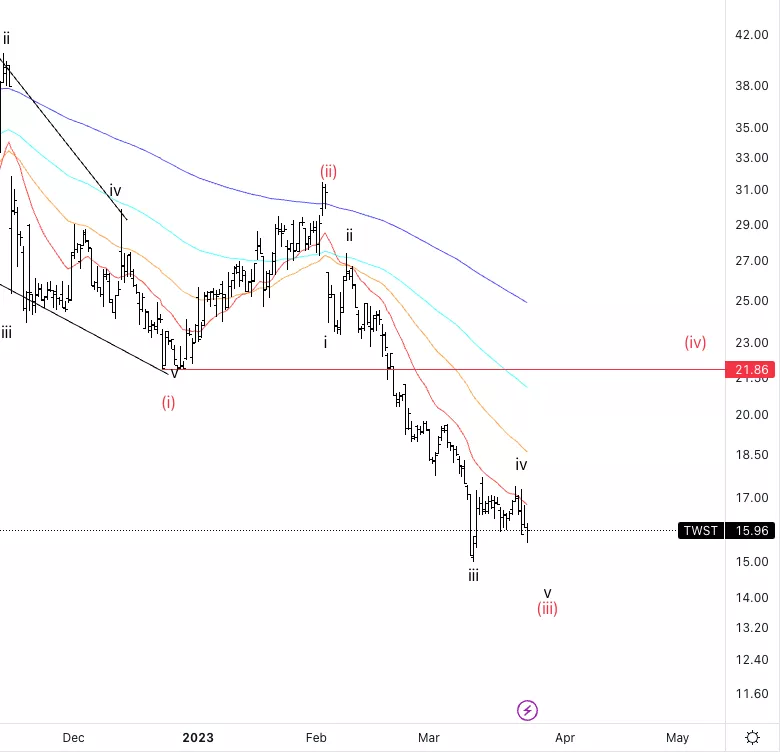
Twist Bioscience Corp., TWST: 4-hour Chart, 24 March 2023.
Twist Bioscience Corp., Elliott Wave Technical Analysis
TWST Stock Market Analysis: As you can see we can identify a five wave move into wave (iii). It looks like we are still within wave iv meaning we might have more downside to go.
TWST Elliott Wave count: Wave iv of (v).
TWST Technical Indicators: Below all averages.
TWST Trading Strategy: Looking for shorts as long as we stay below the 20EMA.
More By This Author:
Elliott Wave Technical Analysis: Biogen Inc. - Thursday, March 23
Elliott Wave Technical Analysis: Bitcoin/U.S. Dollar
Elliott Wave Technical Analysis: Fortinet Inc. - Wednesday, March 22
Disclaimer:


