

Photo by Joshua Mayo on Unsplash
Biogen Inc., Elliott Wave Technical Analysis
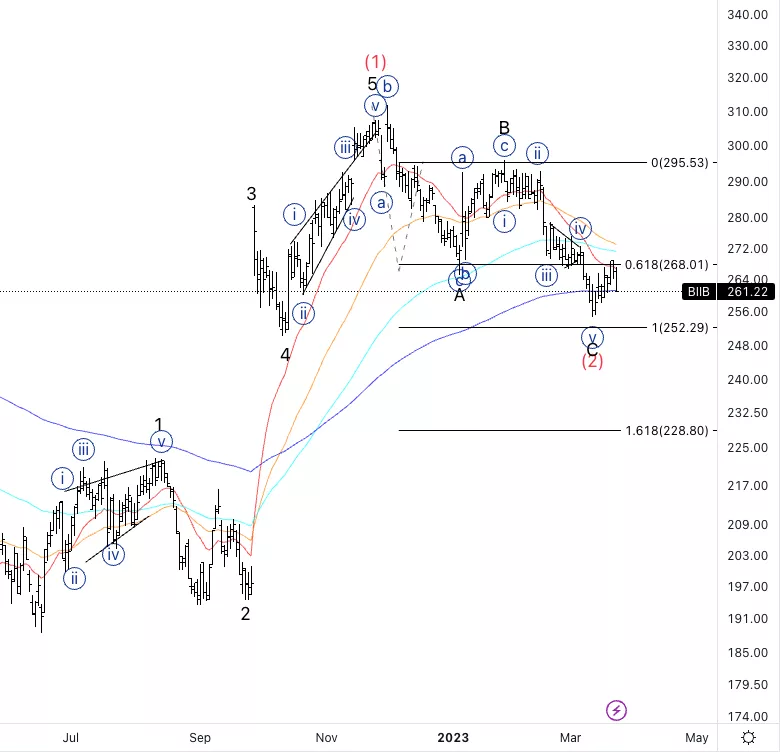
Biogen Inc., (Nasdaq: BIIB): Daily Chart, 23 March 2023.
BIIB Stock Market Analysis: It has been moving as expected from the previous forecast as we seem to have found a bottom in wave C. Looking for upside resumption.
BIIB Elliott Wave Count: Wave C of (2).
BIIB Technical Indicators: 200EMA as support.
BIIB Trading Strategy: Looking for further upside.
Analyst: Alessio Barretta
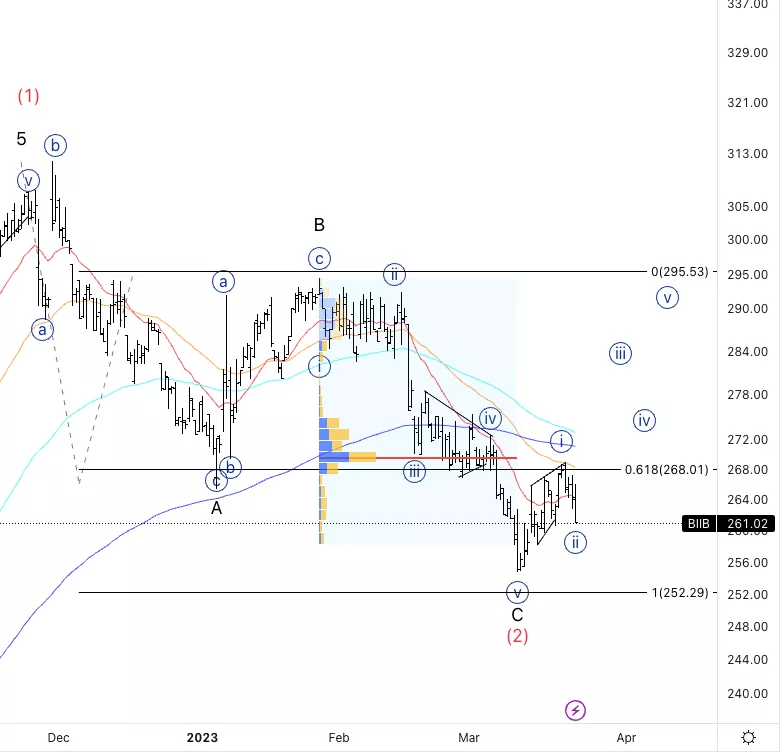
Biogen Inc., BIIB: 4-hour Chart, 23 March 2023.
Biogen Inc., Elliott Wave Technical Analysis
BIIB Stock Market Analysis: Here we see a potential leading diagonal into wave {i} and we could be seeing a pullback in wave {ii}. Looking to find support within the next trading session or else the count will be compromised.
BIIB Elliott Wave count: Wave (c) of {ii}
BIIB Technical Indicators: Between the 20EMA.
BIIB Trading Strategy: Looking for longs after a clear resumption of the uptrend.
More By This Author:
Elliott Wave Technical Analysis: Fortinet Inc. - Wednesday, March 22
Elliott Wave Technical Analysis: AAVE Token/U.S. Dollar
U.S. Indices - Elliott Wave Trading Strategies


Comments
Log in or sign up to join the conversation.