

Image Source: Pixabay
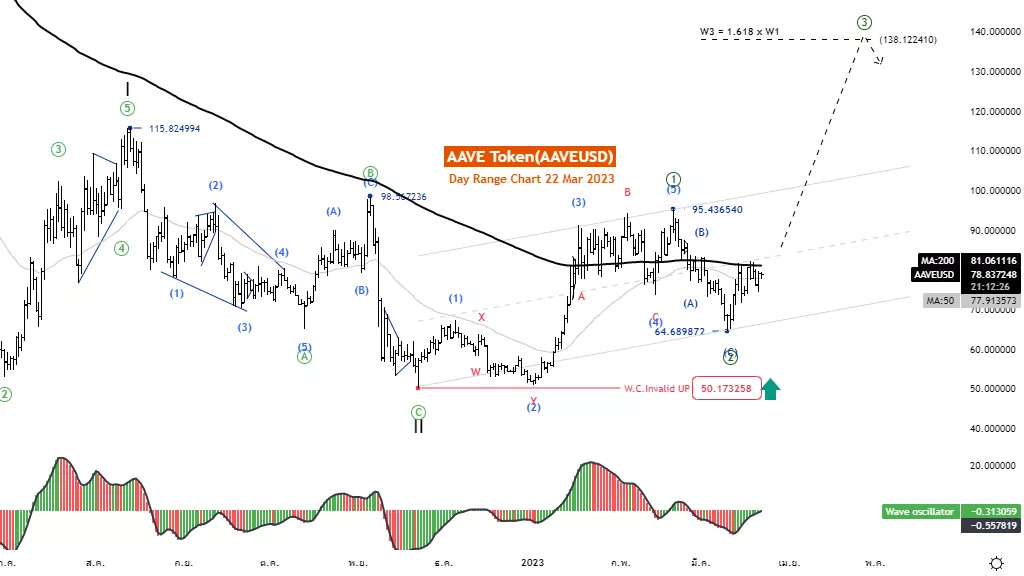
Elliott Wave Analysis TradingLounge Daily Chart, 22 March 2023.
AAVE Token/U.S. Dollar(AAVEUSD)
AAVEUSD Elliott Wave Technical Analysis
Function: Follow trend
Mode: Motive
Structure: Impulse
Position: Wave ((3))
Direction Next higher Degrees: Wave I of Motive
Details: The rise of wave ((3)) is usually equal to 1.618 multiple of the wavelength ((1)).
Wave Cancel invalid Level: 50.173
AAVE Token/U.S. Dollar (AAVEUSD) Trading Strategy: AAVE resumed the upward trend in wave ((3)) with a possibility of reaching the 161.8 level of wave ((1)) at 138.122. In addition, if the price rises above the MA200 line, it indicates a continued upward trend. Continuously in waves ((3))
AAVE Token/U.S. Dollar (AAVEUSD) Technical Indicators: The price is below the MA200 indicating a downtrend. The wave oscillators above Zero-Line momentum are bullish
Analyst: Kittiampon Somboonsod, CEWA
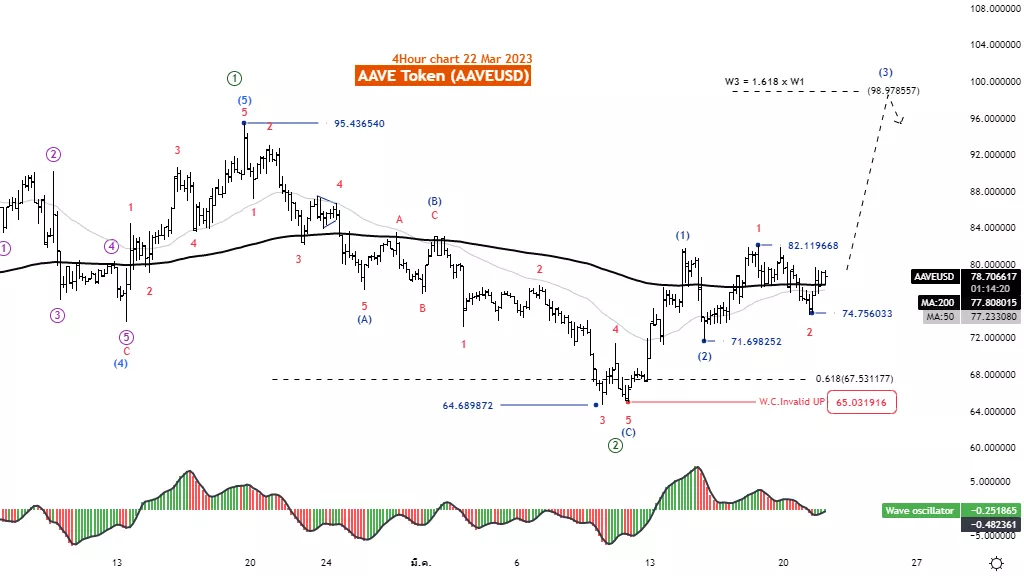
Elliott Wave Analysis TradingLounge 4H Chart, 22 March 2023.
AAVE Token/U.S. Dollar (AAVEUSD)
AAVEUSD Elliott Wave Technical Analysis
Function: Follow trend
Mode: Motive
Structure: Impulse
Position: Wave ((3))
Direction Next higher Degrees: Wave I of Motive
Details: The rise of wave ((3)) is usually equal to 1.618 multiple of the wavelength ((1)).
Wave Cancel invalid Level: 65.0319
AAVE Token/U.S. Dollar (AAVEUSD) Trading Strategy: AAVE resumed the upward trend in wave (3) with a chance to reach the 161.8 level of wave (1) at 98.9. In addition, the price has risen above the MA200 line, indicating a continued upward trend in wave (3).
AAVE Token/U.S. Dollar (AAVEUSD) Technical Indicators: The price is above the MA200 indicating an uptrend. The wave oscillators above Zero-Line momentum are bullish.
More By This Author:
U.S. Indices - Elliott Wave Trading Strategies
Elliott Wave Technical Analysis: Shopify Inc. - Tuesday, March 21
Elliott Wave Technical Analysis: Ethereum/U.S. Dollar


Comments
Log in or sign up to join the conversation.