Elliott Wave Technical Analysis: Shopify Inc. - Tuesday, March 21
Photo by Maxim Hopman on Unsplash
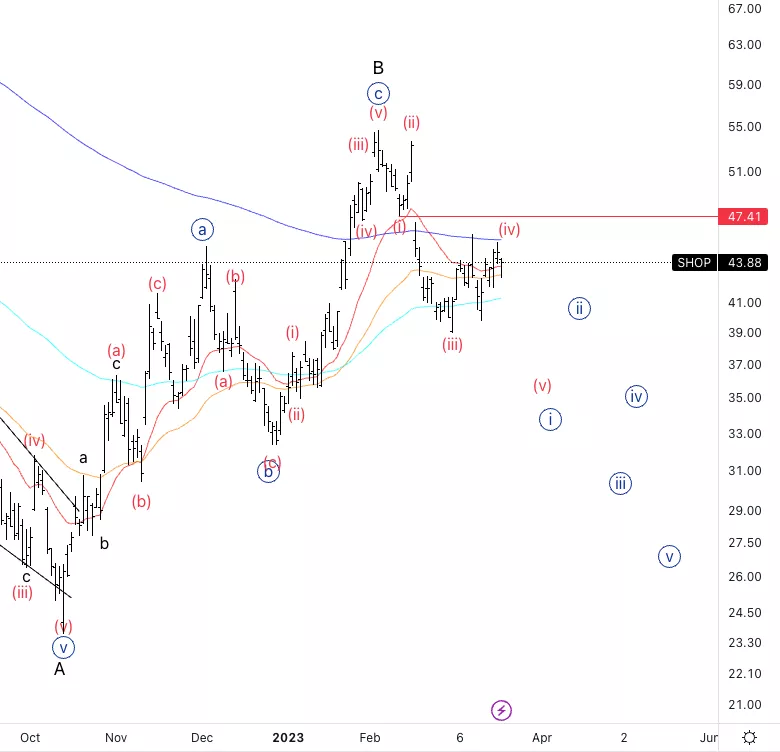
Shopify Inc.,(Nasdaq: SHOP): Daily Chart, 21 March 2023.
SHOP Stock Market Analysis: Shopify keeps moving sideways as expected, as it stays between 20 and 200EMA. As long as we do not break the red line we can assume we will be seeing a further downside.
SHOP Elliott Wave Count: Wave (iv) of {i}.
SHOP Technical Indicators: At the cross of 20 and 200EMA.
SHOP Trading Strategy: Waiting for a potential triangle in wave (iv).

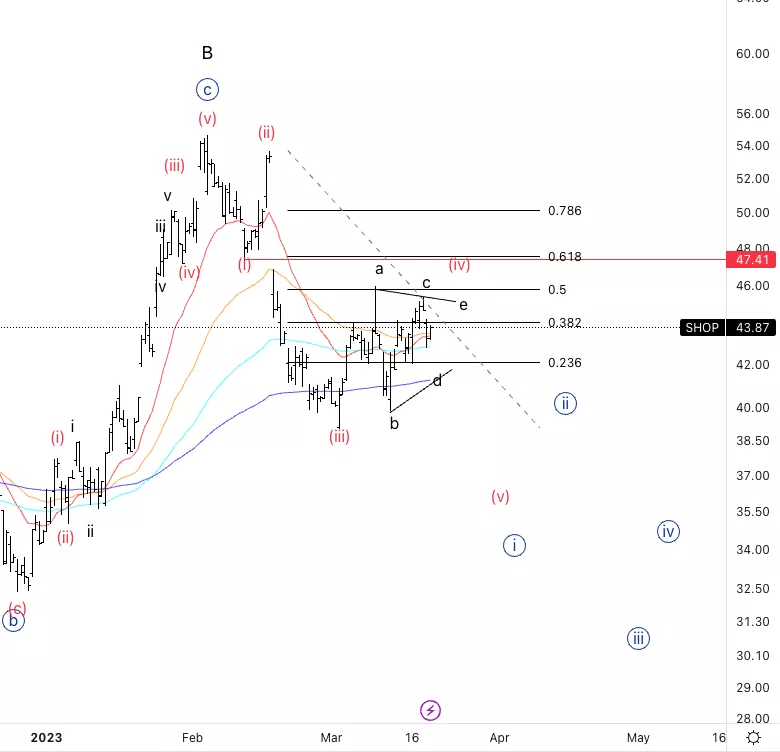
Shopify Inc., SHOP: 4-hour Chart, 21 March 2023.
Shopify Inc., Elliott Wave Technical Analysis
SHOP Stock Market Analysis: We keep moving sideways in a three wave manner, which confirms the fact we are in a corrective structure. We are moving between the 50% and 38.2% retracement of (iii).
SHOP Elliott Wave count: Wave (iv) of {i}.
SHOP Technical Indicators: Above all averages.
SHOP Trading Strategy: Looking for sideways continuation in wave (iv).

More By This Author:
Trading Stocks: SP500 Elliott Wave Analysis
Elliott Wave Technical Analysis: DexCom Inc.
Elliott Wave Technical Analysis: Commodity Markets - Monday, March 20
Disclaimer:


