

Image Source: Pixabay
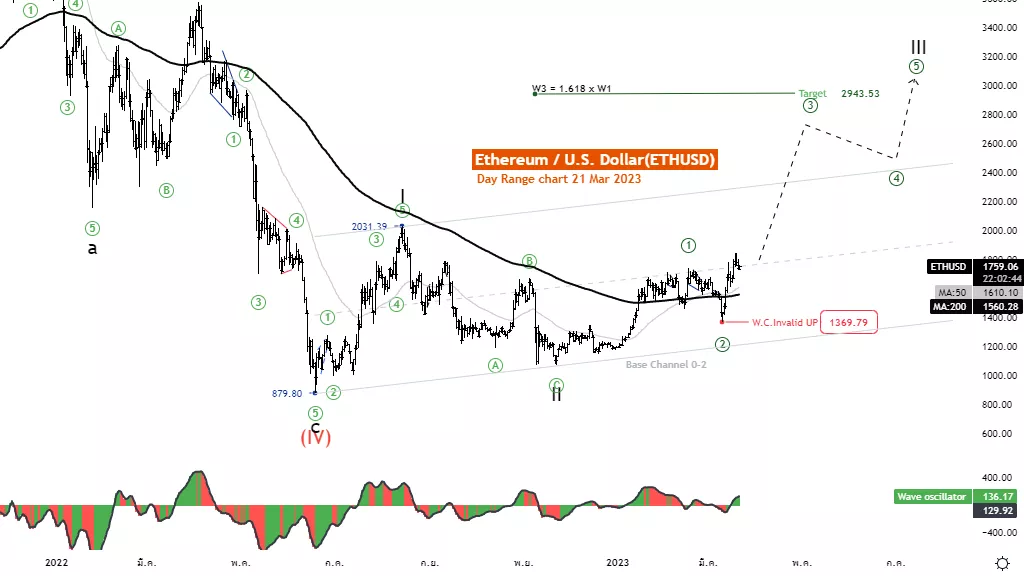
Elliott Wave Analysis TradingLounge Daily Chart, 21 March 2023.
Ethereum/U.S. Dollar (ETHUSD)
ETHUSD Elliott Wave Technical Analysis
Function: Follow trend
Mode: Motive
Structure: Impulse
Position: Wave III
Direction Next higher Degrees: wave (I) of Motive
Details: Wave 3 equals 1.618 multiplied Length of wave 1 at 2943.53
Wave Cancel invalid level: 1073.42
Ethereum/U.S. Dollar (ETHUSD) Trading Strategy: Ethereum resumes its upward trend in wave III with a chance to reach the 161.8 level of wave I at 2943.53. Also, the price has risen above the MA200 line, giving the view to a continued upward trend in wave III.
Ethereum/U.S. Dollar (ETHUSD) Technical Indicators: The price is above the MA200 indicating an uptrend. The wave oscillators above Zero-Line momentum are bullish.
Analyst: Kittiampon Somboonsod, CEWA
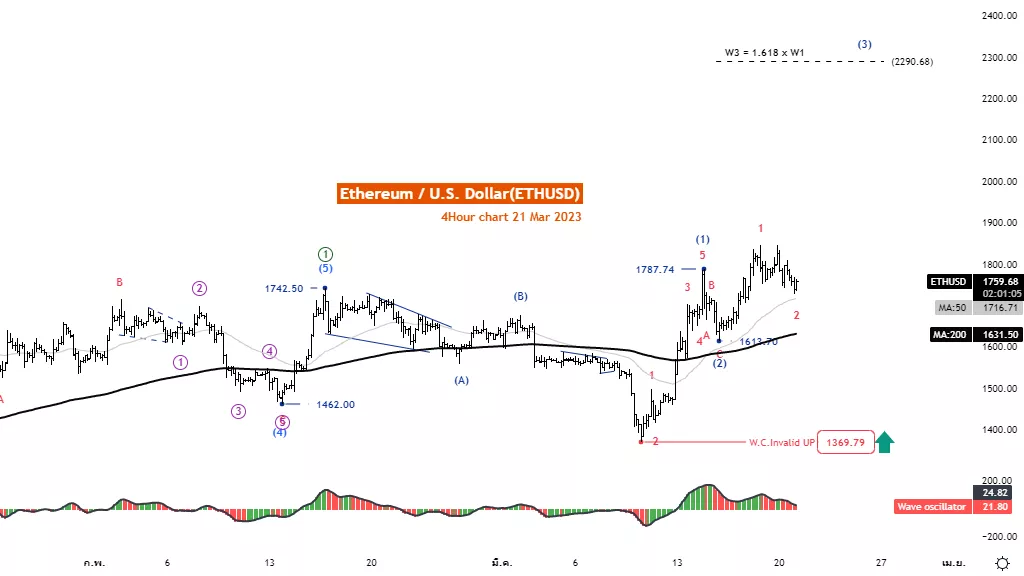
Elliott Wave Analysis TradingLounge 4H Chart, 21 March 2023.
Ethereum/U.S. Dollar (ETHUSD)
Elliott Wave Technical Analysis
Function: Follow trend
Mode: Motive
Structure: Impulse
Position: Wave (3)
Direction Next higher Degrees: wave ((3)) of Motive
Details: Wave 3 equals 1.618 multiplied Length of wave 1 at 2290
Wave Cancel invalid level: 1369
Ethereum/U.S. Dollar (ETHUSD) Trading Strategy: Ethereum resumes its upward trend in wave (3) with a chance to reach the 161.8 level of wave (1) at 2290. Also, the price has risen above the MA200 line, giving the view to a continued upward trend in wave (3).
Ethereum/U.S. Dollar (ETHUSD) Technical Indicators: The price is above the MA200 indicating an uptrend. The wave oscillators above Zero-Line momentum are bullish.
More By This Author:
Trading Stocks: SP500 Elliott Wave Analysis
Elliott Wave Technical Analysis: DexCom Inc.
Elliott Wave Technical Analysis: Commodity Markets - Monday, March 20


Comments
Log in or sign up to join the conversation.