
Elliott Wave Technical Analysis: Fortinet Inc. - Wednesday, March 22

Image Source: Unsplash
Fortinet Inc., Elliott Wave Technical Analysis
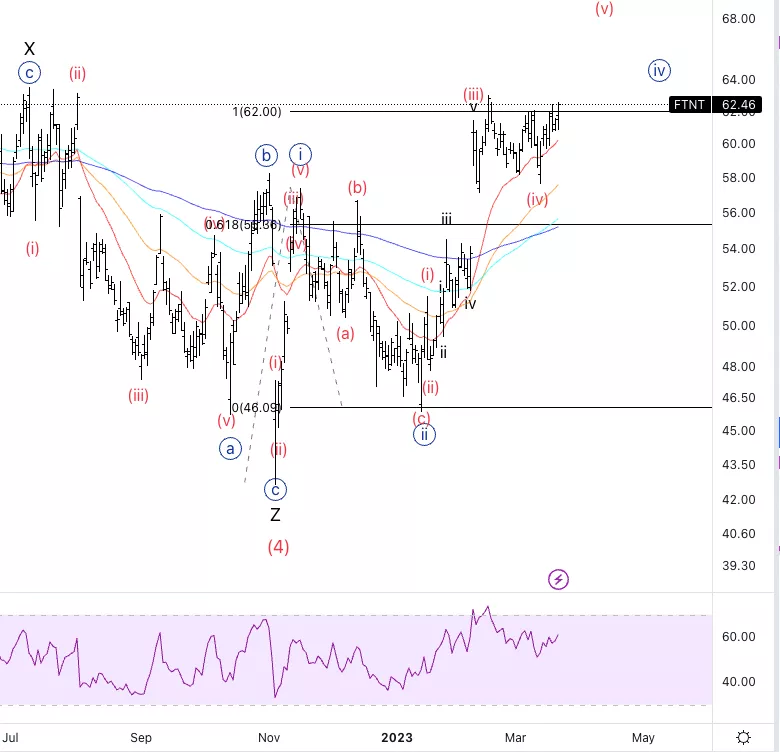
Fortinet Inc., (Nasdaq: FTNT): Daily Chart, 22 March 2023.
FTNT Stock Market Analysis: Looking for further upside into wave (v) of {iii}. There is evidence suggesting we have completed a wave (iii) of {iii}as we have had the highest RSI reading(strongest momentum) at the top of (iii).
FTNT Elliott Wave Count: Wave (v) of {iii}.
FTNT Technical Indicators: Above all averages.
FTNT Trading Strategy: Looking for further upside.
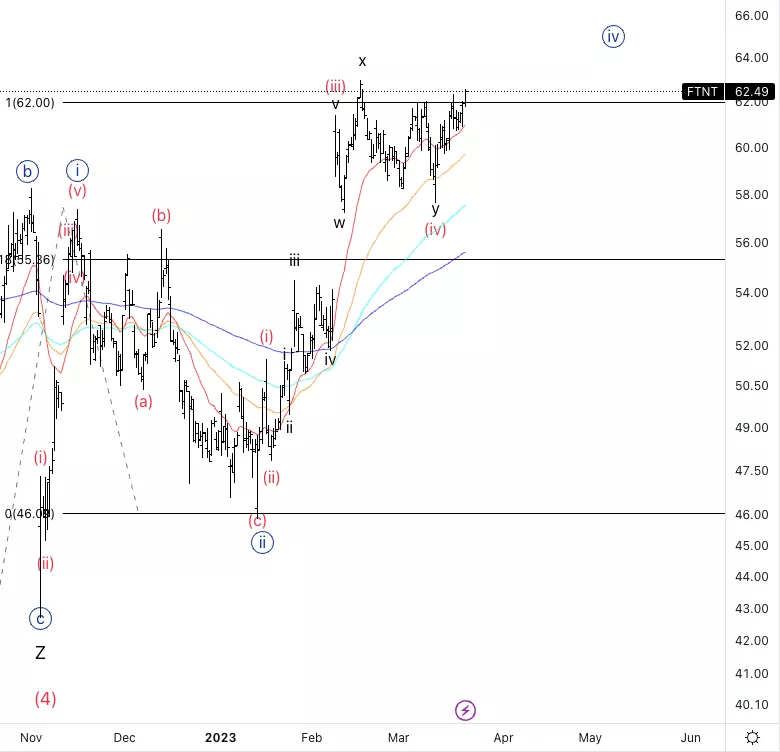
Fortinet Inc., FTNT: 4-hour Chart, 22 March 2023.
Fortinet Inc., Elliott Wave Technical Analysis
FTNT Stock Market Analysis: Looking for further upside as long as we stay supported by the 20EMA. It looks like we are nesting into wave (v) as we have overlapping waves after the bottom in wave (iv) but we keep making higher highs and higher lows.
FTNT Elliott Wave count: Wave (v) of {iii}.
FTNT Technical Indicators: Above all averages.
FTNT Trading Strategy: Looking for longs after a clear three wave pullback.
More By This Author:
Elliott Wave Technical Analysis: AAVE Token/U.S. Dollar
U.S. Indices - Elliott Wave Trading Strategies
Elliott Wave Technical Analysis: Shopify Inc. - Tuesday, March 21
Disclaimer:


