Elliott Wave Technical Analysis: Bitcoin/U.S. Dollar

Image Source: Pexels
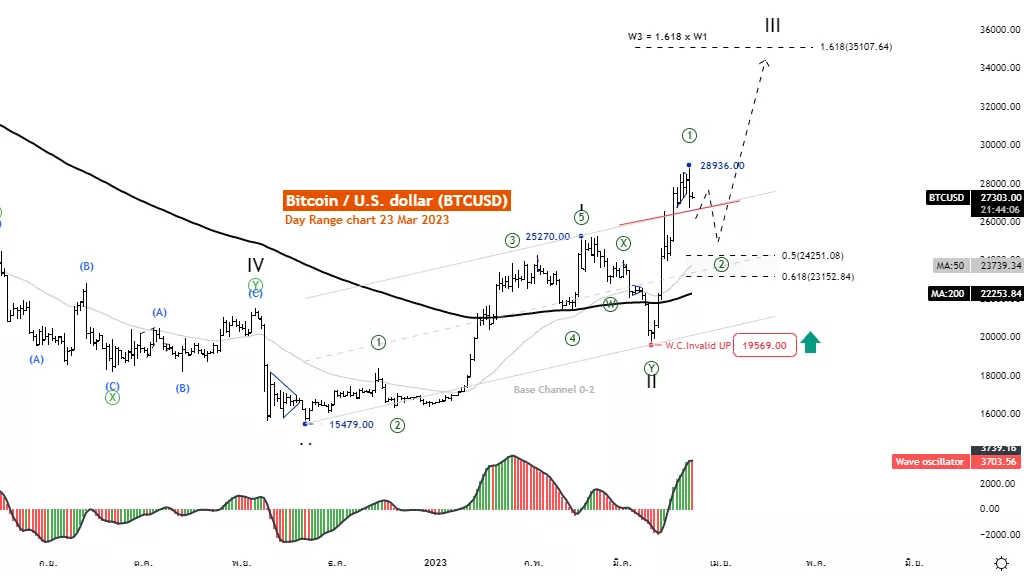
Elliott Wave Analysis TradingLounge Daily Chart, 23 March 2023.
Bitcoin/U.S. Dollar (BTCUSD)
BTCUSD Elliott Wave Technical Analysis
Function: Follow trend
Mode: Motive
Structure: Impulse
Position: Wave III
Direction Next higher Degrees: wave (I) of Motive
Details: Wave 3 is equal to 1.618 multiplied Length of wave 1 at 35366
Wave Cancel invalid level: 15479
Bitcoin/U.S. Dollar (BTCUSD) Trading Strategy: Bitcoin is developing in wave III and is trending towards 1.618 times wave I at 35107 as the price recovers from support at MA200 and breaks the upper channel. Help support this idea. So the overall picture is still a steady increase in the uptrend.
Bitcoin /U.S. Dollar (BTCUSD) Technical Indicators: The price is above the MA200 indicating an uptrend. The wave oscillators above Zero-Line momentum are bullish.
Analyst: Kittiampon Somboonsod, CEWA

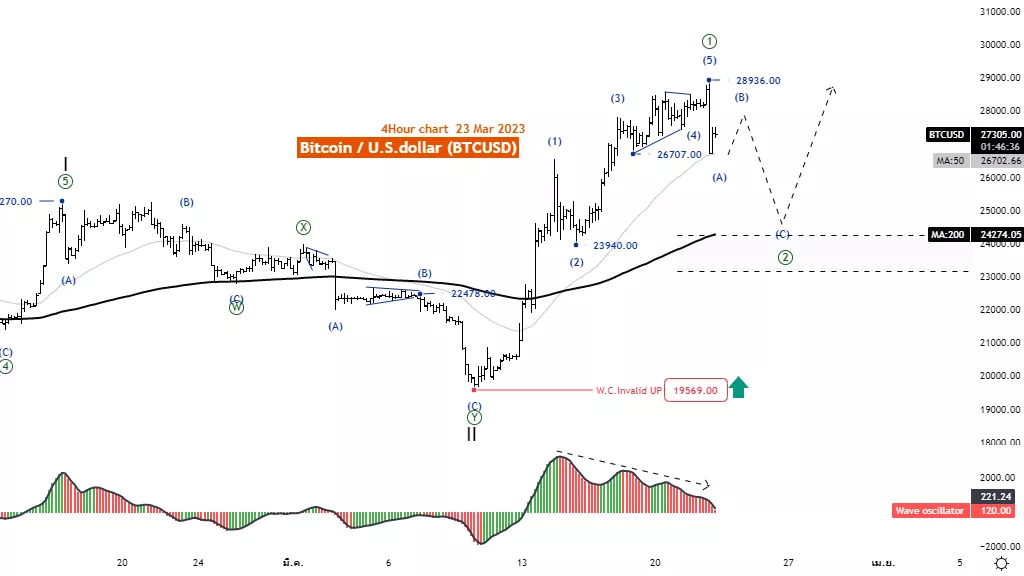
Elliott Wave Analysis TradingLounge 4H Chart, 23 March 2023.
Bitcoin/U.S. Dollar (BTCUSD)
BTCUSD Elliott Wave Technical Analysis
Function: Counter trend
Mode: Corrective
Structure: Zigzag
Position: Wave A
Direction Next higher Degrees: wave ((2)) of Motive
Details: Wave ((2)) usually retraces 50-61.8% of wave ((1)).
Wave Cancel invalid level: 19569
Bitcoin/U.S. Dollar (BTCUSD) Trading Strategy: Wave ((1)) seems to end at the level 28936. As the price structure completes five waves and the Wave Oscillator slows down, it is possible that a reversal in wave ((2)) is ongoing and it is likely to end at the level of 28936. will go to the level of 50 - 61.8% of the wave ((1)) before rising again in the wave ((3)).
Bitcoin/U.S. Dollar (BTCUSD) Technical Indicators: The price is above the MA200 indicating an uptrend. The wave oscillators above Zero-Line momentum are bullish.

More By This Author:
Elliott Wave Technical Analysis: Fortinet Inc. - Wednesday, March 22
Elliott Wave Technical Analysis: AAVE Token/U.S. Dollar
U.S. Indices - Elliott Wave Trading Strategies
Disclaimer:


