
Dissecting The Idiosyncratic Volatility Puzzle

Image Source: Pexels
Idiosyncratic volatility (IVOL) is the volatility of a security that cannot be explained by overall market volatility—it is the risk unique to a particular security. IVOL contrasts with systematic risk, which is the risk that affects all securities in a market (such as changes in interest rates or inflation) and, therefore cannot be diversified away. On the other hand, the risks of high IVOL stocks can at least be reduced through diversification.
IVOL is one of the interesting puzzles in finance because, while idiosyncratic volatility is not typically considered a risk factor because it can be diversified away, empirical research has found that a group of stocks with higher IVOL have produced lower returns. Studies such as “Arbitrage Asymmetry and the Idiosyncratic Volatility Puzzle” by Robert Stambaugh, Jianfeng Yu, and Yu Yuan, which appeared in the October 2015 issue of The Journal of Finance, have provided explanations for the anomaly.
Here is a summary of their key findings:
- The IVOL effect was significantly negative among the most overpriced stocks. However, the effect was very positive among underpriced stocks.
- The negative effect among overpriced stocks was significantly stronger—the negative highest-versus-lowest difference among the most overpriced stocks was 3.7 times the magnitude of the corresponding positive difference among the most underpriced stocks.
- The negative IVOL effect among overpriced stocks was stronger for stocks that were less easily shorted (as proxied by stocks with low institutional ownership).
- The vast majority of the differences in returns were explained by the short side (the most overpriced stocks).
- IVOL increased monotonically, moving across deciles from the most underpriced to the most overpriced.
- The IVOL effect was strongest among overpriced small stocks—consistent with small stocks being more difficult/expensive to short than large stocks. The effect held for large stocks as well, though it was no longer statistically significant at conventional levels.
- The average negative relation between IVOL and expected return was stronger in periods when there was a market-wide tendency for overpricing (when the Baker-Wurgler Sentiment Index was high) because stocks are more likely to be overpriced and arbitrage risk and costs are more likely to be high during high sentiment.
Why the Anomaly Persists
The explanation for why the anomaly persists is that there is “arbitrage asymmetry,” the greater ability and/or willingness of investors to take a long position as opposed to a short position when they perceive mispricing in security. Asymmetry occurs because there are more significant risks and costs involved in shorting, including the potential for unlimited losses.
In addition to the greater risks and costs of shorting, for stocks with a low level of institutional ownership, sufficient shares may not be available to borrow in order to sell short. Because institutions are the main lenders of securities, studies have found that when institutional ownership is low, the supply of stocks to loan tends to be sparse. Thus, short selling tends to be more expensive. Furthermore, the charters of many institutions prevent, or severely limit, shorting. Finally, there is the risk that adverse moves can force capital-constrained investors to reduce their short positions before realizing profits that would ultimately result from corrections of mispricing.
Stambaugh, Yu, and Yuan’s findings are consistent with those of Andrew Detzel, Jefferson Duarte, Avraham Kamara, Stephan Siegel, and Celine Sun, authors of the May 2019 study “The Cross-Section of Volatility and Expected Returns: Then and Now,” which extended the data sample to begin in July 1926 and end in 2016. In addition, they benchmarked returns against newer asset pricing models: the Fama-French five-factor model (market beta, value, size, profitability, and investment); a Fama-French six-factor model, which adds momentum; the four-factor q-model of Kewei Hou, Chen Xue, and Lu Zhang (market beta, size, profitability, and investment); the four-factor mispricing model of Stambaugh and Yuan; and the Bayesian six-factor model of Francisco Barillas and Jay Shanken, which is updated monthly. They found that the difference in abnormal returns between stocks with high and low IVOL decreased but remained significant out of sample. They also found that while the newer Fama-French five- and six-factor and q-factor models did not resolve the IVOL anomaly, the four-factor model of Stambaugh and Yuan and the six-factor model of Barillas and Shanken did. Finally, they showed that the returns of the high IVOL stocks were so low because they tended to behave like small-cap growth stocks, with low profitability and high levels of real investment (which have historically produced very poor returns).
New Research
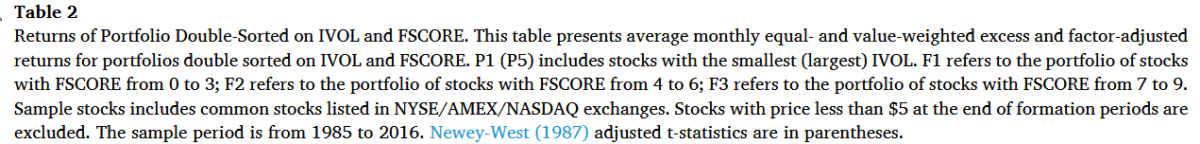
Zhaobo Zhu, Wenjie Ding, Yi Jin, and Dehua Shen contribute to the IVOL literature with their study “Dissecting the Idiosyncratic Volatility Puzzle: A Fundamental Analysis Approach,” published in the October 2023 issue of Research in International Business and Finance. They began by noting: “High IVOL implies that investors have high divergence of opinion on the valuation of stocks possibly due to high information uncertainty for these stocks. If so, then firms’ most recently available fundamental information should help resolve such high information uncertainty. Moreover, we argue that as fundamental information could be good or bad, it enables us to differentiate the positive and negative IVOL-return relation. Stock prices are expected to increase (decrease) when high information uncertainty is resolved with the arrival of good (bad) news. Therefore, we expect a positive (negative) IVOL-return relation for stocks with strong (weak) fundamentals. Furthermore, we expect that the negative IVOL effect for stocks with poor fundamentals is stronger than the positive IVOL effect for stocks with strong fundamentals in the absolute value due to arbitrage asymmetry.” They added: “Buying stocks with strong fundamental strength is easier and less risky than shorting stocks with poor fundamental strength in the formation period when information uncertainty is high, leading to a relatively weaker effect of the arrival of good news on the subsequent price change.”
Their data sample covered common stocks listed on the NYSE, AMEX, and Nasdaq, excluding stocks with prices lower than $5, and spanned 1985-2016. To measure a firm’s quarterly fundamental strength, they used Piotroski’s composite fundamental index (F-score)—ranging from 1 (lowest) to 9 (highest)—which includes nine metrics: return on assets, operating cash flow, change in return on assets, accruals, change in leverage (long-term) ratio, change in current ratio, change in number of shares, change in gross margin, and change in asset turnover ratio. Consistent with prior research, they found:
The equal-weighted portfolio of stocks with the lowest IVOL (P1) significantly outperformed the portfolio of stocks with the highest IVOL (P5) by an average return of 0.65% (t-stat = -2.28). The monthly outperformance was 0.86% (t-stat = -5.04), 0.25% (t-stat = -2.18), and 0.20% (t-stat = -1.11) after adjusting for the Fama-French three factors (FF3), Fama-French five factors (FF5), and Stambaugh and Yuan’s mispricing four factors (M4), respectively. Value-weighted results were similar (see table below).
(Click on image to enlarge)
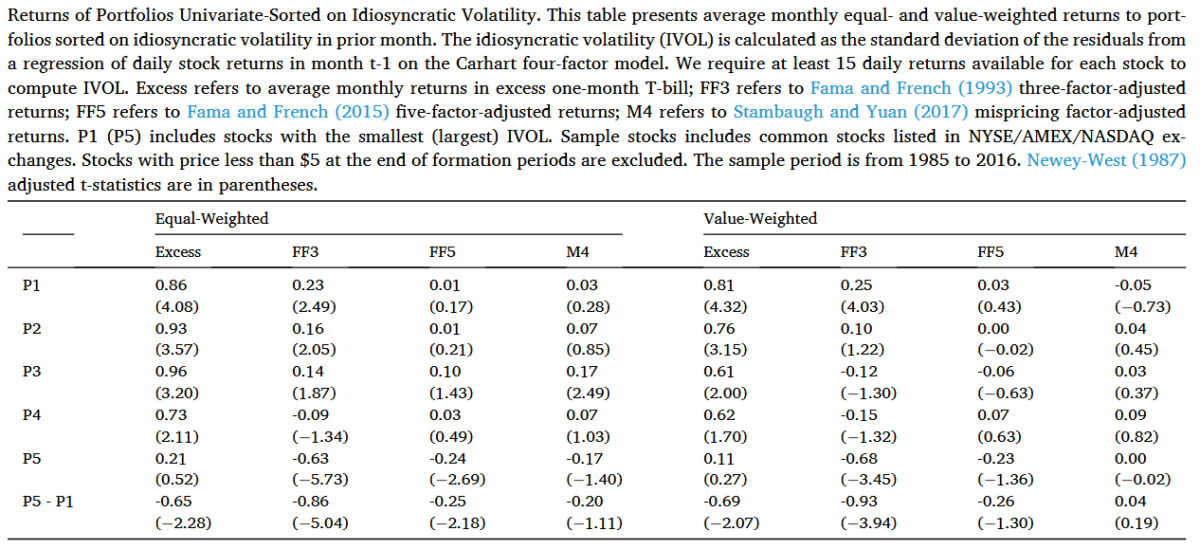
The results are hypothetical results and are NOT an indicator of future results and do NOT represent returns that any investor actually attained. Indexes are unmanaged and do not reflect management or trading fees, and one cannot invest directly in an index.
- The IVOL-return relation varied depending on the fundamental strength of stocks—the IVOL-return relation for stocks with strong (poor) fundamental strength was positive (negative).
- This finding was robust to different widely accepted asset pricing models. For example, the value-weighted return disparity between high (P5 in table below) and low IVOL (P1) quintile portfolios for stocks with poor fundamentals (F1 in table below) was -0.74% (t-stat = 3.01). In contrast, the return disparity for stocks with strong fundamentals (F3, P5-P1 in table below) was 0.53% (t-stat = 1.94) after adjusting for Fama-French five factors
(Click on image to enlarge)
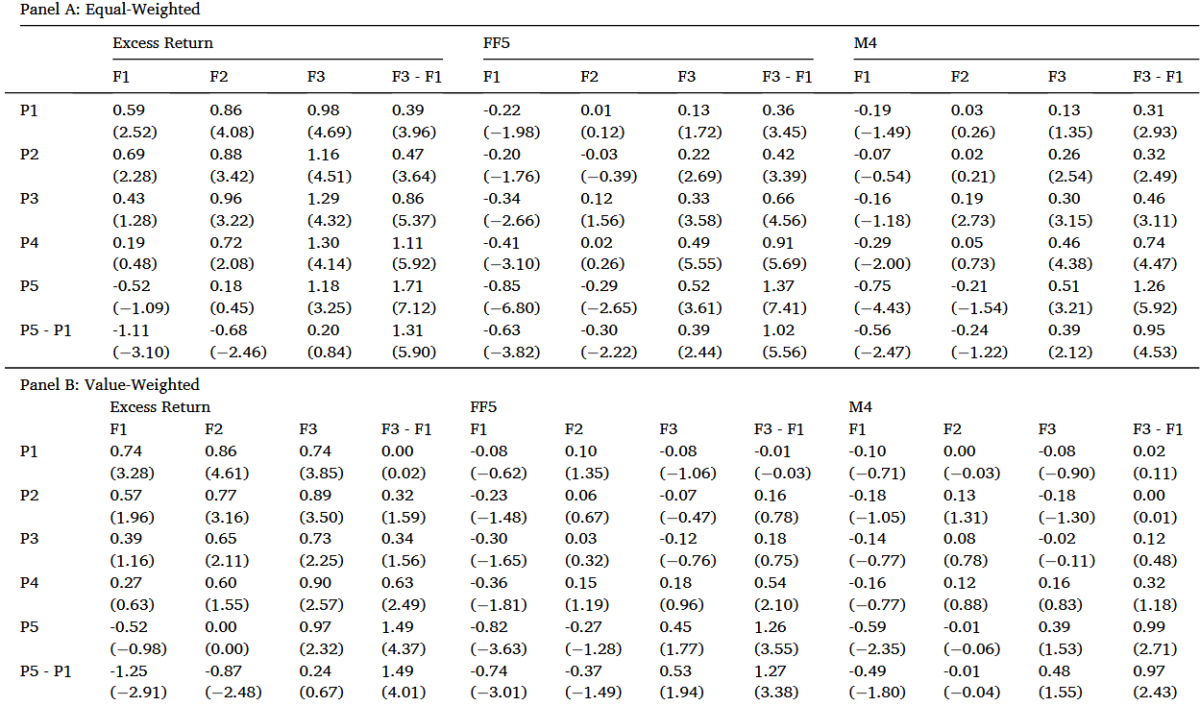
The results are hypothetical results and are NOT an indicator of future results and do NOT represent returns that any investor actually attained. Indexes are unmanaged and do not reflect management or trading fees, and one cannot invest directly in an index.
- The effect of fundamental strength was strongest for high IVOL stocks. The value-weighted return disparity between stocks with strong fundamental strength and stocks with poor fundamental strength was 1.49% (statistically significant at the 99% confidence level) among high IVOL stocks but zero among low IVOL stocks.
- Testing the implications of arbitrage asymmetry, high IVOL stocks significantly underperformed low IVOL stocks by 1.61% in the subsample of low institutional ownership stocks. In comparison, the underperformance was only 0.50% and insignificant otherwise.
- For stocks with poor fundamental strength, the negative IVOL effect was more pronounced following high sentiment periods.
- Consistent with the argument that the arrival of fundamental news could mitigate the information uncertainty that leads to the negative IVOL effect, the value-weighted raw return disparity (-0.53%) between high and low IVOL portfolios was not significant in the subsample that included only stocks whose earnings announcements occurred in the formation month. In contrast, the raw return disparity (-0.67%) was significant in the subsample that included only stocks whose earnings announcements did not occur in the formation month.
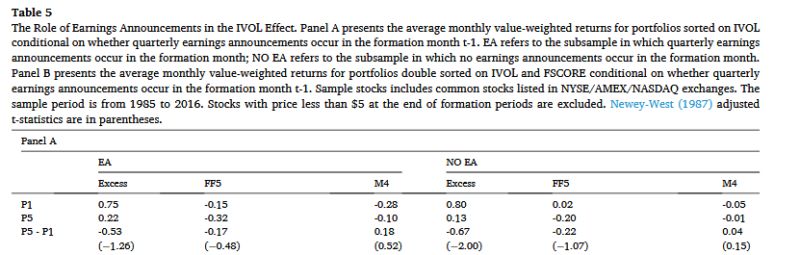
The results are hypothetical results and are NOT an indicator of future results and do NOT represent returns that any investor actually attained. Indexes are unmanaged and do not reflect management or trading fees, and one cannot invest directly in an index.
Their findings led the authors to conclude: “The IVOL effect is mainly driven by high-IVOL stocks, and fundamental strength could efficiently identify high-IVOL stocks that have high future returns and those that have low future returns.”
Investor Takeaways
The research findings demonstrate that firm fundamentals can efficiently identify the positive (negative) IVOL-return relation among stocks with strong (weak) fundamentals. Moreover, the negative IVOL-return relation dominates the positive relation because of arbitrage asymmetry. These findings help us understand the role idiosyncratic volatility plays in explaining returns.
A key takeaway is that the finding of more uncorrected overpricing than uncorrected underpricing doesn’t mean a fund has to short an overpriced stock to benefit. The fund can help by avoiding the purchase of overpriced stocks with a filter that screens out stocks with the characteristic creating mispricing. An excellent example of stocks that tend to be overpriced are the so-called meme stocks (such as GameStop (GME), AMC Entertainment (AMC), and Bed Bath & Beyond (BBBY)). Thus, when selecting funds to implement their investment strategy, investors should consider funds that screen out the high IVOL stocks with poor fundamentals (such as small-cap growth stocks) with low profitability and high levels of real investment. Systematic quant-based long-only mutual funds can put this knowledge to work by using screens to eliminate stocks that would otherwise be on their eligible buy list.
More By This Author:
The Democratization Of Investing And The Evolution Of ETFsESG Preferences Negatively Affecting Market Efficiency
The Role Of ESG In Equity Returns Across Private, Primary, And Secondary Markets
Performance figures contained herein are hypothetical, unaudited and prepared by Alpha Architect, LLC; hypothetical results are intended for illustrative purposes only. Past performance is not ...
more

