
The next couple of weeks are big for tech earnings. MSFT, GOOG and AMZN report this week, and AAPL the next, among others. Leading into this, consensus estimates have trended lower, and stocks have rallied to multi-month highs. Concurrently, market cap-weighted tech-heavy indices are giving out signs of fatigue. It is a make-or-break for equity bulls.
With only 18 percent of S&P 500 companies having reported their March quarter, it is early in the 1Q23 earnings season. Financials were the first to go, and results particularly from the big banks drew a positive responses, although this was not enough to meaningfully lift the S&P 500.
This week, several leading tech outfits report. Their results have the potential to act as a make-or-break as the large cap index, as well as the Nasdaq – both the composite and the 100 – are sitting at crucial juncture.
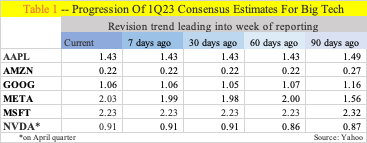
Microsoft (MSFT) and Google owner Alphabet (GOOG) report on Tuesday, Facebook owner Meta Platforms (META) on Wednesday, and Amazon (AMZN) on Thursday. Of the six companies in Table 1, Apple (AAPL)’s results are due out on May 4 and Nvidia (NVDA)’s in late May, with the latter ending its quarter this month.
Leading into this, these stocks are at or near multi-month highs. Last week, AAPL rose to the highest since last August, even as GOOG two weeks ago rose to the highest since last September. AMZN last Friday rallied to nearly a three-month high, while META last week rose to an 11-month high. MSFT three weeks ago rose to the highest since last August.
For most of them, estimates have trended lower over at least the last 90 days (Table 1), so the bar is low.
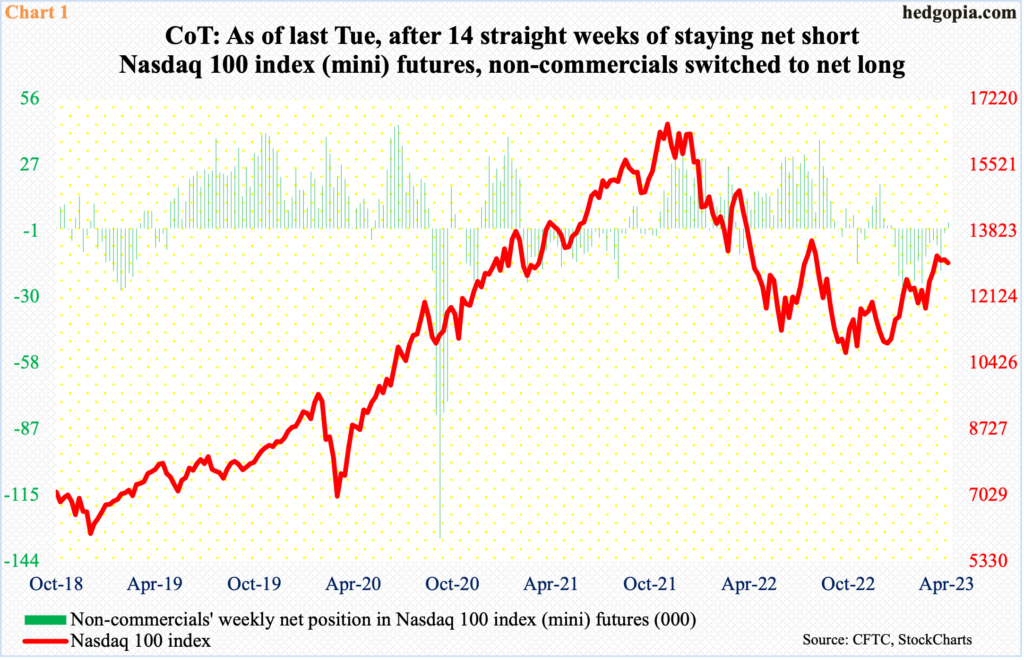
Ahead of this, non-commercials as of last Tuesday switched to net long Nasdaq 100 index mini futures, adding 4,803 contracts week-over-week to go net long 2,673. Before this, they were net short for 14 consecutive weeks (Chart 1). Back then, they switched to net short in the week to January 10; the cash, having just bottomed, kept rallying until February 2 when it tagged 12881 and retreated; it then troughed at 11695 on March 13, before rallying again. Throughout these ups and downs, the Nasdaq 100’s bias was up, yet non-commercials stayed with their net shorts.
Last Tuesday, the Nasdaq 100 ticked 13196 and pulled back. Odds are growing the bias will remain downward in the sessions ahead.
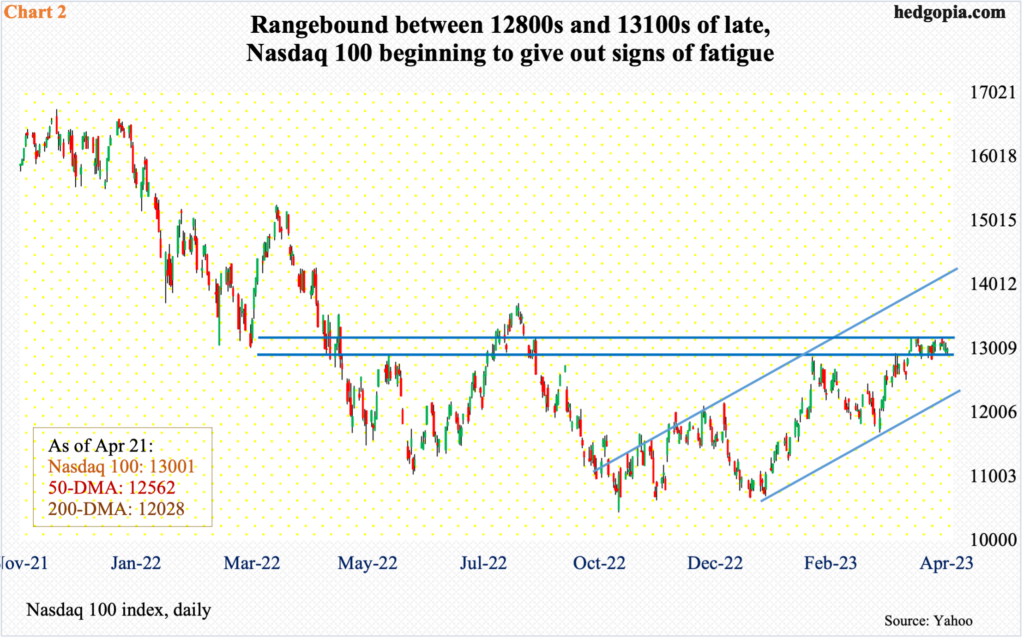
The tech-heavy index is giving out signs of fatigue.
The Nasdaq 100 (13001) has remained trapped between 13100s and 12800s for three weeks now. The index broke out of 12800s in late March, going on to tag 13204 on the 4th this month and head lower. For the last three to four weeks, rally attempts have repeatedly stopped at 13100s (Chart 2).
Longs have struggled of late, but so have shorts. The latter would have scored victory should a cross-down between the 10- and 20-day, which seems to be in the works, completes in the sessions head; the 10-day is already slightly pointing down.
For tech bulls, this week offers an opportunity to use 1Q23 earnings results to regain the upward momentum. Else, 12800s will be the first to go, and that could set in motion a process to unwind the weekly overbought condition.
The Nasdaq 100 is a market cap-weighted index. So is the S&P 500. Large companies obviously wield a large influence on these indices. The sector is home to the leading publicly traded companies in the US.
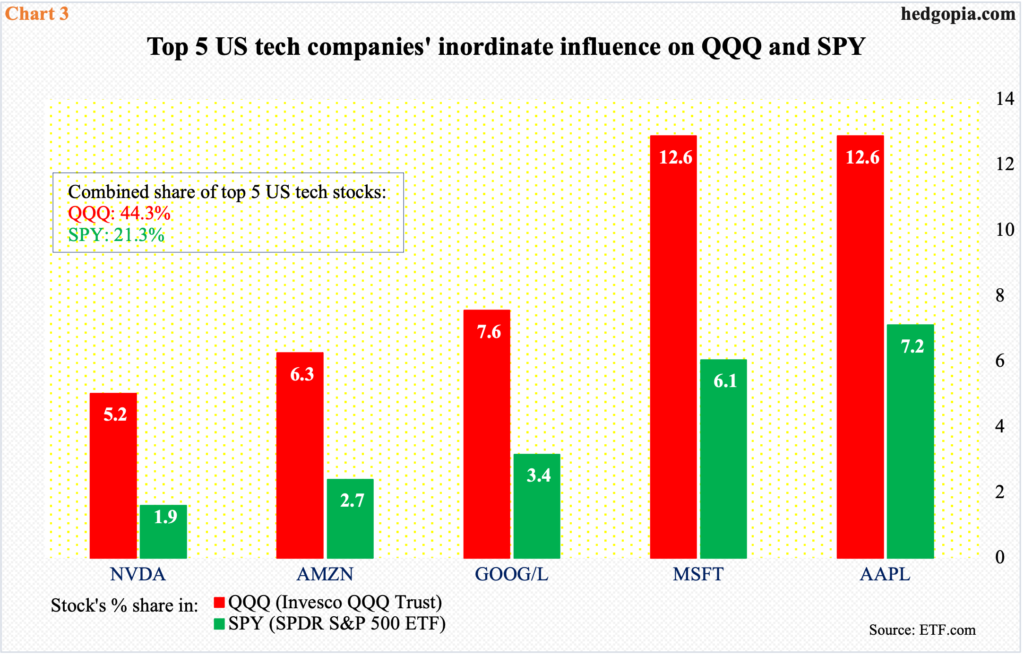
In QQQ (Invesco QQQ Trust), the top eight weights are all tech – AAPL ($2.6 trillion market cap), MSFT ($2.1 trillion), GOOG/L ($1.4 trillion), AMZN ($1.1 trillion), NVDA ($670 billion), META ($552 billion), TSLA ($522 billion) and Broadcom (AVGO, $264 billion), with the ninth spot going to PepsiCo (PEP, $255 billion) and the 10th to Costco Wholesale (COST, $224 billion). In SPY, the top five are tech – AAPL, MSFT, GOOG/L, AMZN and NVDA.
As these stocks so, so go these indices. In QQQ, the share of the top five stands at 44.3 percent; in SPY, this is 21.3 percent (Chart 3).
It goes without saying that the results from MSFT, GOOG, and AMZN this week will have a bearing on the S&P 500, which seems to be itching to go lower.
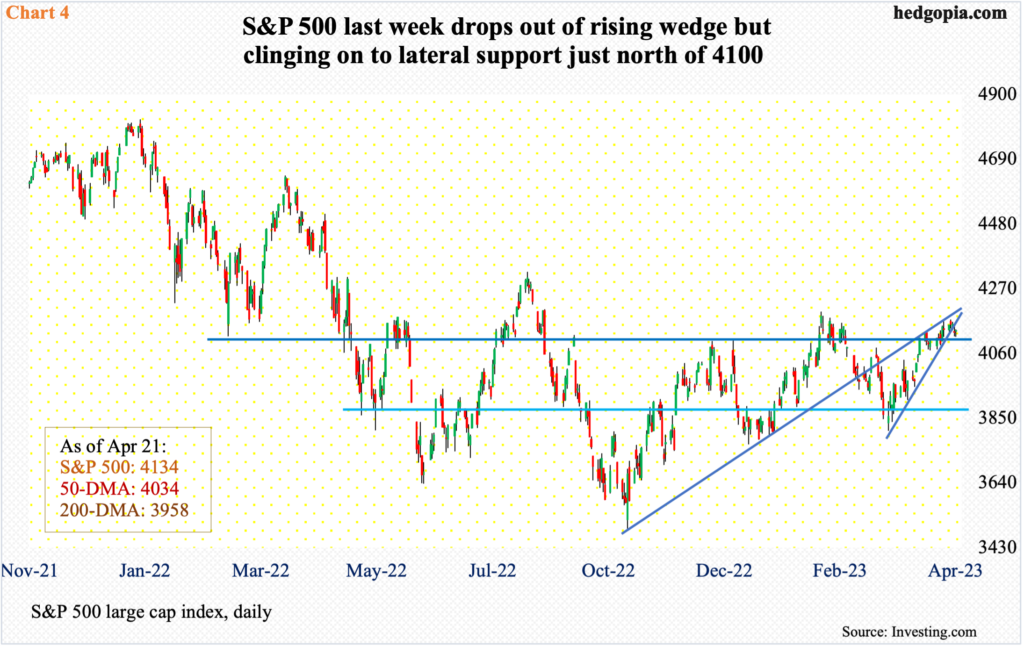
The large cap index reclaimed 4100 on March 31. On its way there, it rallied from the October 2022 low of 3492 – probably why it is beginning to act like it is tired. Nothing much came out of the 4100 breakout.
Last week, the S&P 500 fell out of a rising wedge, inching lower 0.1 percent with a doji. This was the second weekly doji in three weeks. On the daily, longs are still defending the 10-day, but exhaustion signs are showing up, with last Friday forming a hanging man and Thursday a long-legged doji right on the average. Conditions are ripe for shorts to take the upper hand, which they will do should big tech extend help this week.
More By This Author:
CoT: Peek Into Future Thru Futures, Hedge Funds PositioningsCoT Report: Peek Into Future Through Futures, How Hedge Funds Are Positioned
Info Tech Regains Go-To Status This Year, Even As Several Related Metrics Raise Yellow Flag


Comments
Log in or sign up to join the conversation.