
CoT: Peek Into Future Thru Futures, Hedge Funds Positionings
Following futures positions of non-commercials are as of April 18, 2023.
10-year note: Currently net short 680.1k, up 41k.
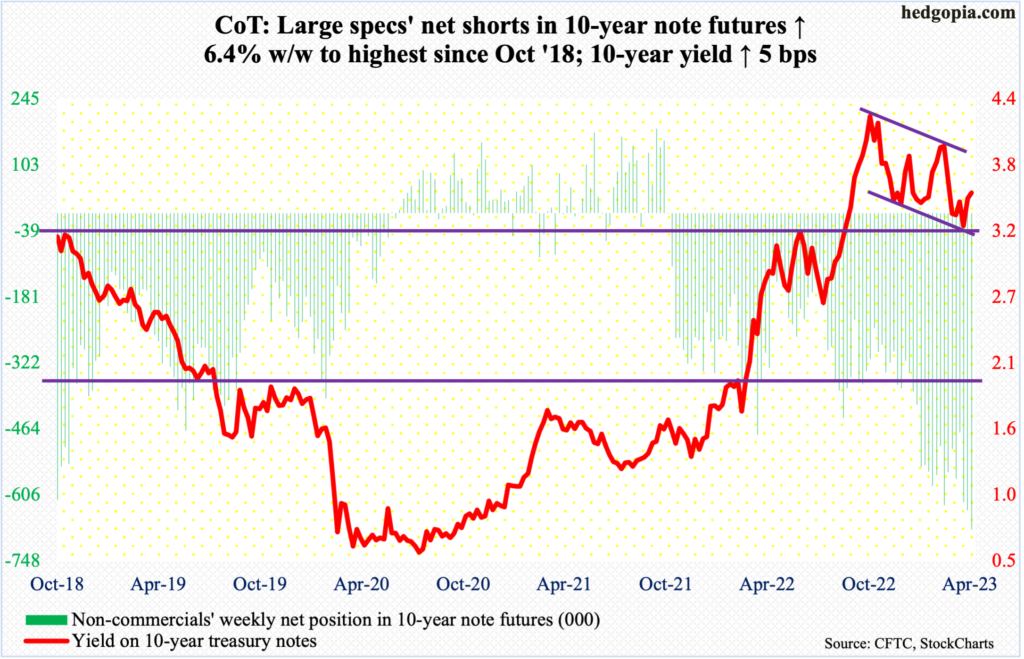
Non-commercials added another 41,004 contracts to their already-elevated holdings of net shorts in 10-year note futures. The 680,081 count is the highest since October 2018.
This week, they were on the right side of trade as the 10-year treasury yield rose five basis points to 3.57 percent; nevertheless, the rates were as high as 3.64 percent on Wednesday.
The 10-year treasury yield dropped from 4.33 percent last October to the April 6th low of 3.25 percent. That low was made on dual support – horizontal going back two decades and descending channel from last October’s high.
From this perspective, a break of 3.25 percent to the downside has the potential to quickly unwind this trade. Non-commercials can hurriedly close out their positions, putting the yields under further downward pressure. This is a scenario that at least needs to be given some thought given how lopsided non-commercials’ holdings now look.
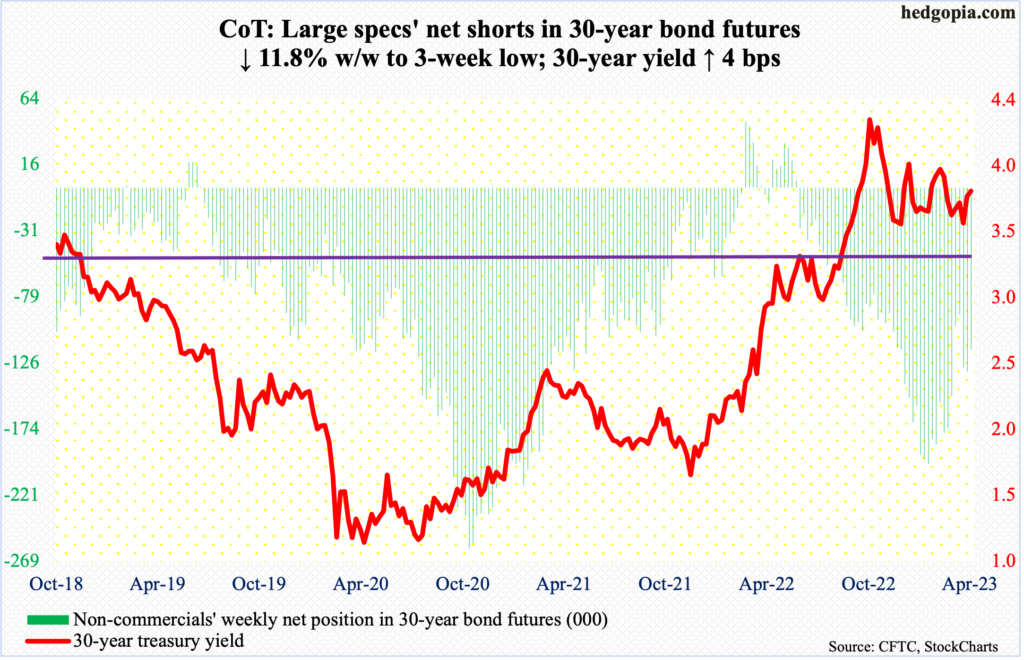
30-year bond: Currently net short 116.9k, down 15.7k.
Major economic releases for next week are as follows.
On Tuesday, the S&P Case-Shiller home price index (February) and new home sales (March) are due out.
Nationally in January, US home prices rose 3.8 percent year-over-year. This was the slowest price inflation annually since December 2019. Since prices rose at record 20.8 percent in March last year, the rate of growth has decelerated each month.
Sales of new homes in February rose 1.1 percent month-over-month to a seasonally adjusted annual rate of 640,000 units – a six-month high.
Durable goods orders (March) will be published on Wednesday. Orders for non-defense capital goods ex-aircraft – proxy for business capex plans – inched lower 0.1 percent m/m in February to $75.1 billion (SAAR). The metric reached a fresh record $75.4 billion last August.
GDP (1Q23, advance) is on deck for Thursday. In 4Q22, real GDP grew at an annualized rate of 2.6 percent – lower than 3Q’s 3.2 percent. But before that in 2Q and 1Q, the economy shrank 0.6 percent and 1.6 percent respectively.
Friday brings the employment cost index (1Q23), personal income/spending (March) and the University of Michigan’s consumer sentiment index (April, final).
In 4Q last year, total compensation of private-industry workers grew 5.1 percent y/y. This was preceded by growth of 5.2 percent in 3Q and 5.5 percent in 2Q, with the latter highest since 2Q84.
In the 12 months to February, headline and core PCE (personal consumption expenditures) increased five percent and 4.6 percent respectively. The two peaked last year at seven percent in June and 5.4 percent in February, in that order. Core PCE – the Fed’s favorite measure – remains way above the central bank’s two percent goal.
April’s preliminary reading showed consumer sentiment rose 1.5 points m/m to 63.5 – a two-month high. Last June, the index hit 50, which was the lowest on record (data goes back to January 1978).
WTI crude oil: Currently net long 265.3k, down 6.2k.
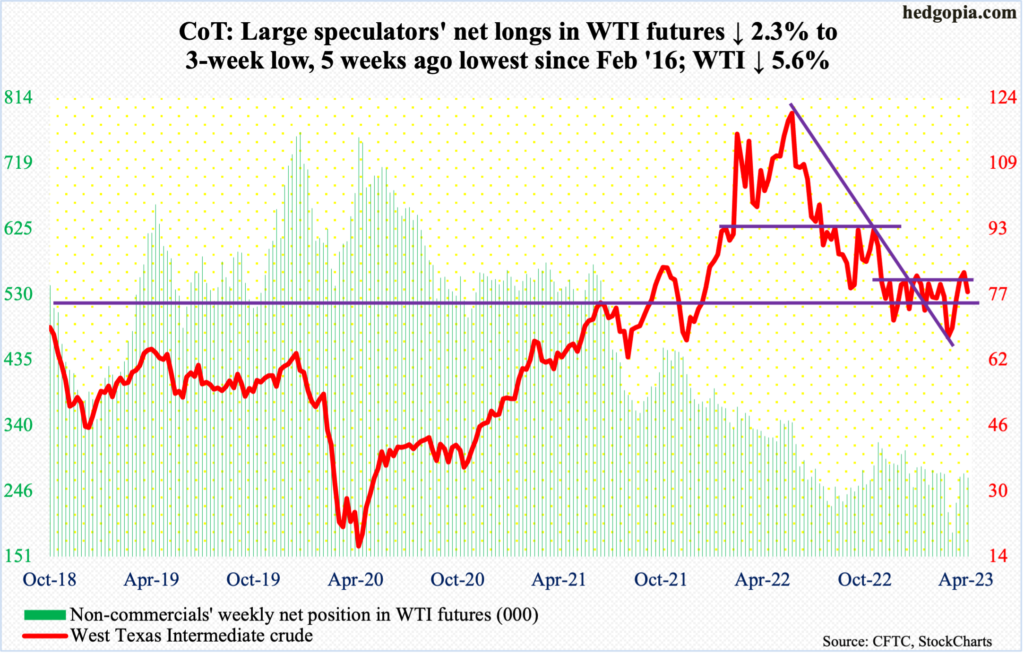
No sooner did WTI ($77.87/barrel) break out of a four-month range between $71-$72 and $81-$82 than the crude was pushed back into it. On the 3rd this month, it gapped up on the back of an announcement by eight OPEC+ producers, including Saudi Arabia, Kuwait, and the United Arab Emirates, to cut crude output by a combined 1.16 million barrels per day until the end of the year. WTI then broke out of the above range on the 12th, ticking $83.53 intraday, before hitting the wall.
The April 12th high was made just under the 200-day moving average. This week, the crude rolled over, down 5.6 percent and back into the range. Friday’s intraday low of $76.72 was well bid just above the 50-day ($76.43). A little under, at $75.72, the April 3rd gap gets filled. So, for now, this support likely holds. Else, there is always the lower end of the above range.
In the meantime, as per the EIA, US crude production in the week to April 14 remained unchanged week-over-week at 12.3 million barrels per day. Crude imports grew 101,000 b/d to 6.3 mb/d. As did gasoline stock, which rose 1.3 million barrels to 223.5 million barrels. Stocks of crude and distillates, however, fell – by 4.6 million barrels and 355,000 barrels to respectively 466 million barrels and 112.1 million barrels. Refinery utilization increased 1.7 percentage points to 91 percent.
E-mini S&P 500: Currently net short 344.3k, up 36.6k.
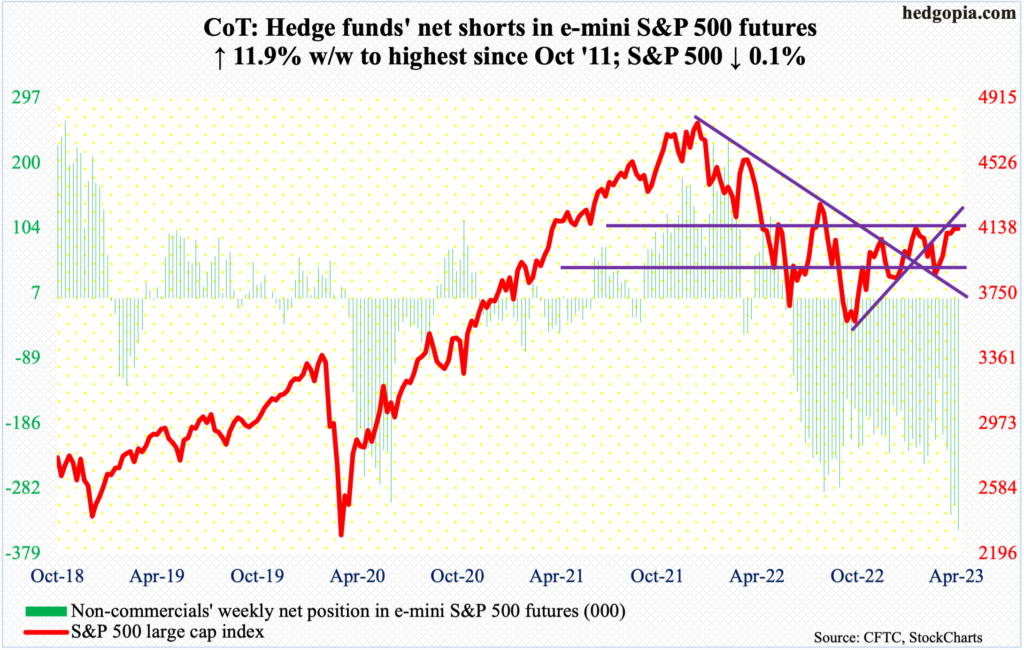
Non-commercials are the shortest they have ever been since October 2011. In the week to March 14, they were net short 119,819 contracts in e-mini S&P 500 futures, with the cash at 3921. In the week to Tuesday this week, they held 344,257 contracts; the S&P 500 closed at 4155, touching 4169 intraday. The large cap index closed out the week at 4134.
The index reclaimed 4100 on March 31. This could potentially have been an important breakout but nothing much has come out of it – not yet anyway. Non-commercials are betting things will not change anytime soon, and it is unlikely they get squeezed in the near future (more on this here).
This week, the S&P 500 inched lower 0.1 percent with a doji. This was the second weekly doji in three weeks. On the daily, longs are still defending the 10-day, but signs of fatigue are showing up, with Friday forming a hanging man and Thursday a long-legged doji right on the average.
Odds heavily favor the non-commercials in the days and weeks ahead.
In the meantime, US-based equity funds went back to bleeding. In the week to Wednesday, $856 million was redeemed. This followed last week’s tiny inflows of $53 million, which came on the heels of withdrawals of $56.2 billion over seven of eight weeks (courtesy of Lipper). Also, in the week to Wednesday, SPY (SPDR S&P 500 ETF), VOO (Vanguard S&P 500 ETF) and IVV (iShares Core S&P 500 ETF) took in $2.3 billion, following inflows of $1.3 billion in the prior week. This was preceded by two-week redemptions of $7.1 billion (courtesy of ETF.com).
Concurrently, Investor Intelligence’s bullish percent in the week to Tuesday firmed up two percentage points w/w to 50.7 percent, which was the highest reading since November 2021; the bearish percent slid three-tenths of a percentage point w/w to 24 percent, which was the lowest since January 2022. Sentiment is beginning to lean a little too optimistic.
Euro: Currently net long 164.4k, up 1k.
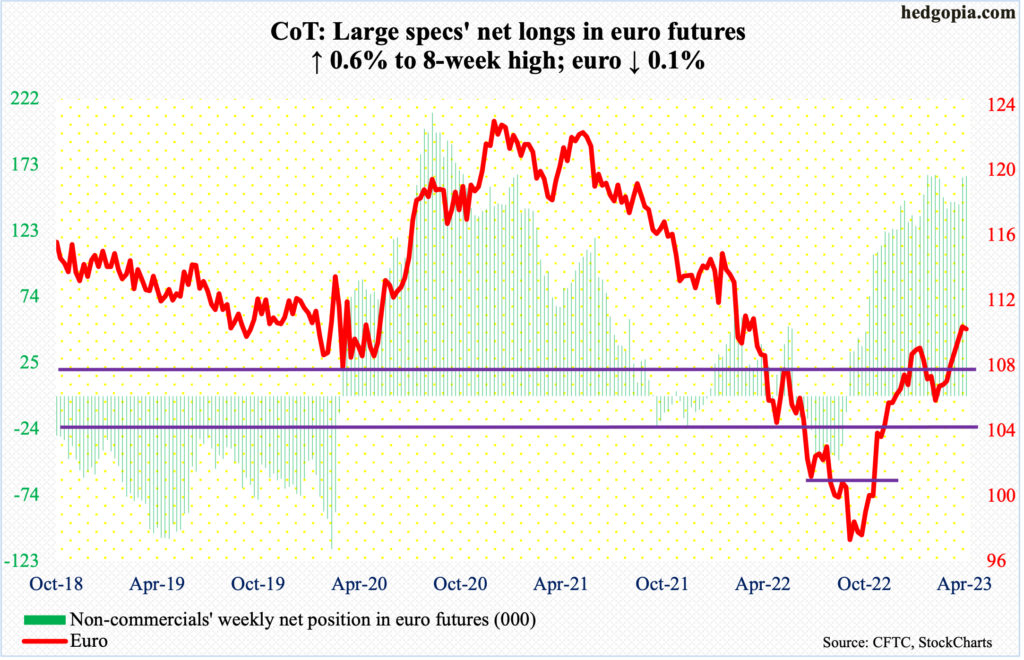
Yet another attempt to break out of $1.09-$1.10, and yet another failure!
On Friday, the euro rose as high as $1.1038 intraday but only to finish the session at $1.0986 with a spinning top. Last week, the currency ticked $1.1069 on Thursday and $1.1074 on Friday.
A spinning top also formed on the weekly this week, which edged lower 0.1 percent. In the event further weakness develops, euro bulls can step up and defend the 50-day ($1.0765), or, in a worse-case scenario, regroup near $1.04-$1.05, which has been an important level going back at least eight years and which was reclaimed last December.
Gold: Currently net long 189.9k, down 2.9k.
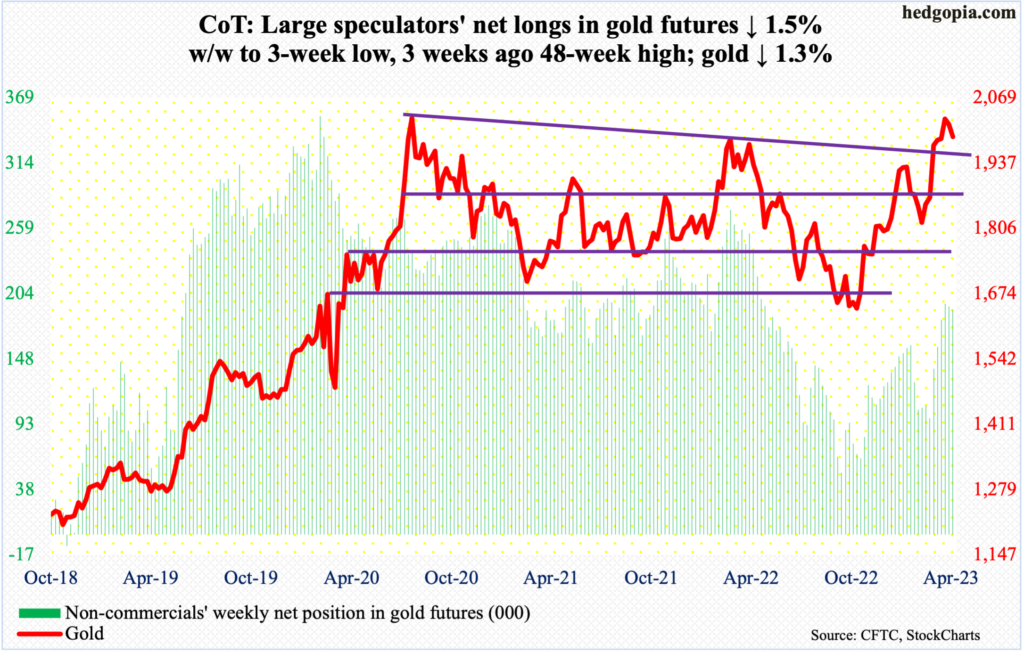
Gold bugs probably are not happy with the way April is shaping up. With five sessions left, the monthly candle has formed a long upper wick. If the month ends here, this will have been a third unsuccessful attempt north of $2,050 in a little under three years.
In August 2020, the metal ticked $2,089 – an all-time high. Then, in March 2022, it tagged $2,079 before rolling over. This time around, gold touched $2,063 on the 13th this month and headed south. Intraday Wednesday, $1,981 was tagged, followed by Friday’s $1,982 intraday and $1,991/ounce close.
Bulls were unable to save $2,000, which gold broke out of early this month after having gone sideways for most of the second half last month. After that is $1,970s, which has not been tested in earnest.
Nasdaq 100 index (mini): Currently net long 2.7k, up 4.8k.
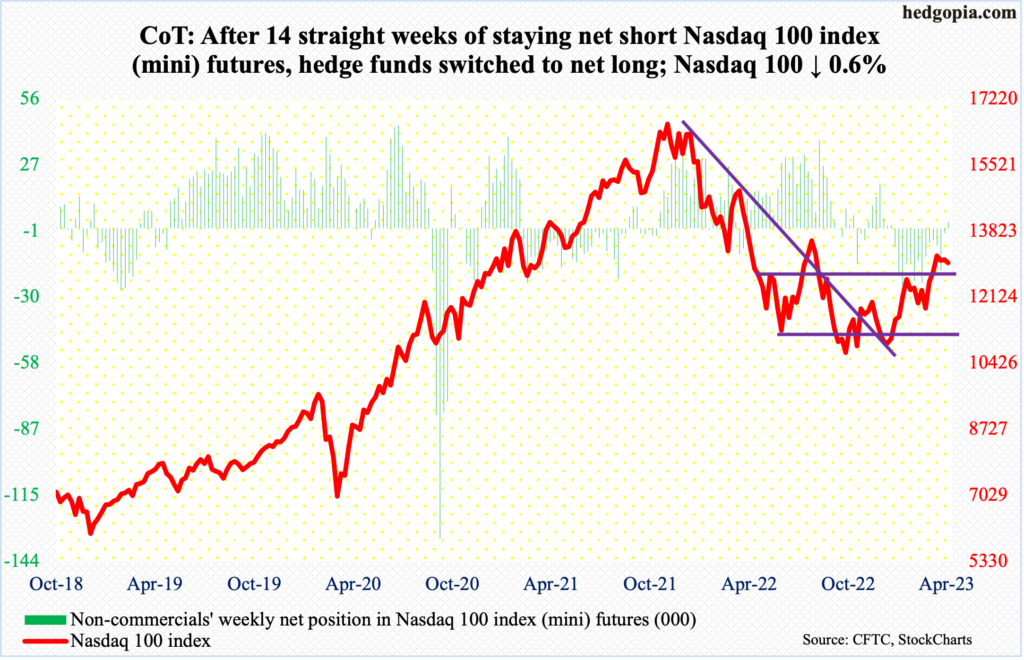
Next week, several leading tech outfits report – Microsoft (MSFT) and Google owner Alphabet (GOOG) on Tuesday, Facebook owner Meta Platforms (META) on Wednesday and Amazon (AMZN) and Intel (INTC) on Thursday, among others.
Ahead of this, after 14 consecutive weeks of staying net short, non-commercials switched to net long, although not by a huge amount. Their bullish bias has come at an interesting juncture, though.
The Nasdaq 100 for now remains trapped between 13100s and 12800s. It broke out of the latter in late March, subsequently tagging 13204 on the 4th this month, and that was it. For the last four weeks, rally attempts have repeatedly stopped at 13100s.
The weekly seems to be itching to unwind its overbought condition.
On the daily, a cross-down between the 10- and 20-day seems to be in the works, with merely 50 points separating the two and the former already slightly pointing down. If tech bulls fail to use next week’s earnings to their advantage, it will just be a matter of time before the Nasdaq 100 (13001) loses 12800s.
Russell 2000 mini-index: Currently net short 59.2k, up 14k.
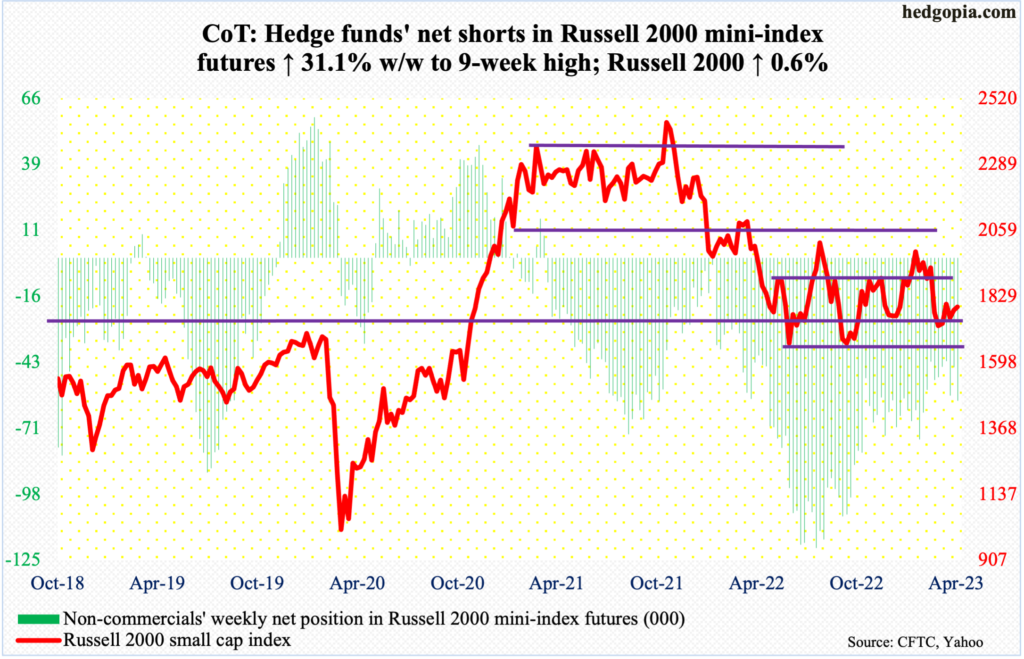
Yet again, small-cap bulls struggled to stay north of 1800, which represents the mid-point of the 1700-1900 range the Russell 2000 has been in since January last year. Intraday, it tagged 1810 on Tuesday and 1803 on both Monday and Wednesday, but staying there proved difficult, with a weekly close of 1792.
Since mid-March, the small cap index has been held down by the underside of a broken rising trendline from last October. As well, Tuesday’s high was made just under the 200-day (1826). For now, small-cap bulls need to prove themselves.
US Dollar Index: Currently net long 10.5k, down 2.8k.
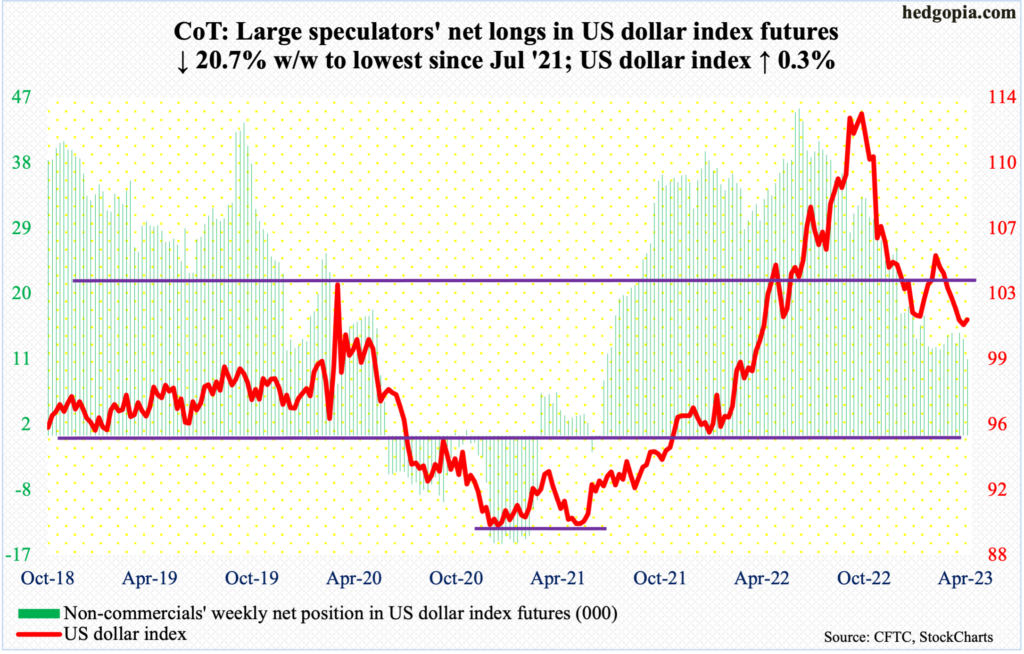
The US dollar index rallied 0.3 percent this week, which in normal circumstances should not be that big of a deal but it is in this case since this was the first up week in eight.
Last Friday, the index ticked 100.42 intraday. At 100-101 lies eight-year horizontal support. In all five sessions this week, the lows were made in 101.20s and .30s, ending the week at 101.55.
This is an opportunity for dollar bulls to put their foot down. The 10- and 20-day are converging; at the present rate, a crossover looks imminent. Further, the daily Bollinger bands are narrowing, which often occurs just before a sharp move – either up or down.
The US dollar index peaked last September at 114.75. After a downtrend like this, a reflex rally only makes sense.
VIX: Currently net short 63.8k, up 14.4k.
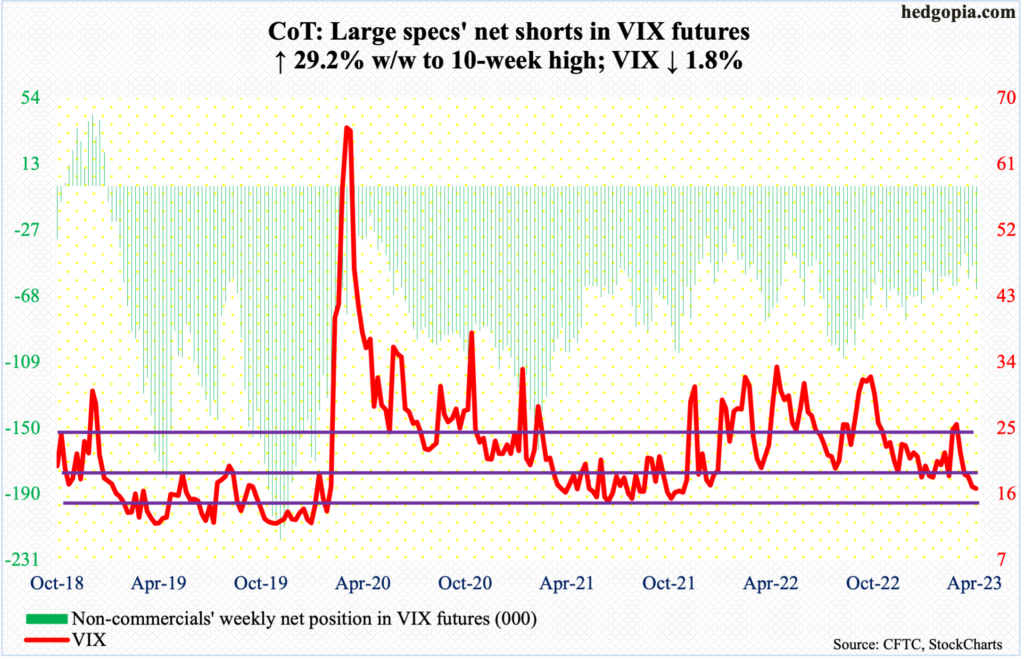
Volatility keeps compressing. The S&P 500 shed 0.1 percent for the week, and VIX still dropped 0.3 points to 16.77. In fact, it fell as low as 16.17 on Wednesday; this was the lowest print since November 2021.
A rising trendline from November 2017 when VIX printed an all-time low of 8.56 is intact to slightly broken. A decisive break to the downside will open the door toward 14-15.
That said, the daily is way oversold, with the first line of sand for volatility bulls at 17.70s.
More By This Author:
CoT Report: Peek Into Future Through Futures, How Hedge Funds Are Positioned
Info Tech Regains Go-To Status This Year, Even As Several Related Metrics Raise Yellow Flag
After Decent Rally In Recent Weeks, Sellers Get Active At Resistance On Major Equity Indices


