

Image Source: Pexels
Lest we forget, a visual recap of what exactly happened when Trump started announcing Section 232 and Section 301 measures.
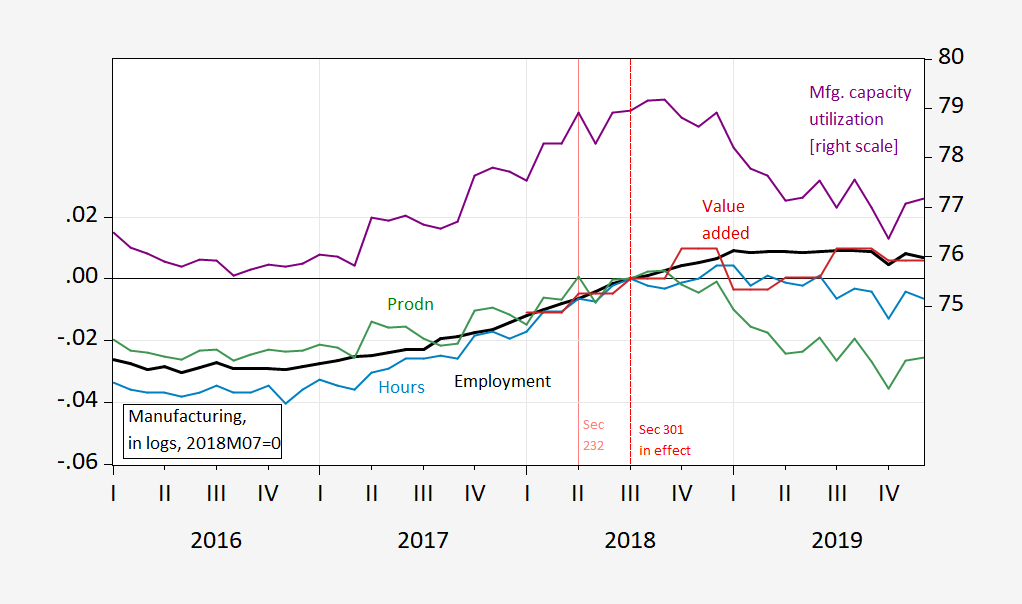
Figure 1: Manufacturing employment (bold black, left scale), hours (light blue, left scale), production (green, left scale), valued added (red, left scale), all in logs 2018M07=0; and capacity utilization (purple, right scale). Source: BLS, Federal Reserve, BEA via FRED, and author’s calculations.
Since exports broke off trend after the imposition of tariffs (for whatever reason), one shouldn’t be too surprised at the plateauing-off of measures of manufacturing activity in the wake of the tariff war’s start (see also formal econometric studies, discussed by Cox and Russ here).
More By This Author:
Real Average WagesNationwide Grocery Prices At 2024M01 Levels
Instantaneous Core Inflation, With PPI And Nowcasted PCE Deflator


Comments
Log in or sign up to join the conversation.