

Image Source: Pexels
From the CPI release:
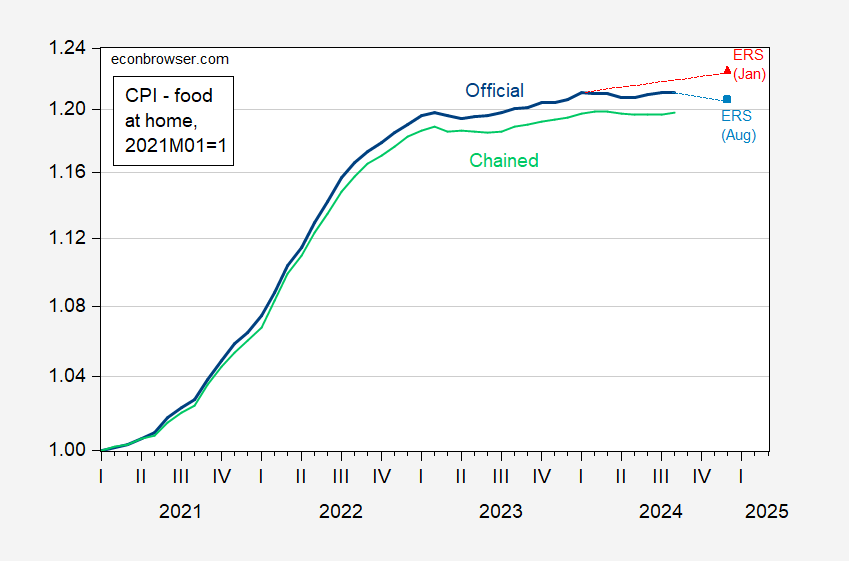
Figure 1: CPI – food at home (blue), ERS forecast as of January (red triangle), ERS forecast as of August (light blue square), Chained CPI – food at home (light green), all normalized to 2020M01=1.00. Chained food at home CPI component seasonally adjusted by author using X-13 (in logs). Source: BLS, USDA ERS, and author’s calculations.
Note that food at home prices are essentially at January 2024 levels, regardless of using the official CPI, or the chained CPI. Given August prices, the ERS August forecast (based on pre-August release data) suggests a slight downward movement in the remaining months. However, since the prediction interval is 0.4% to 2.0% (for y/y point prediction of 1.2%), price increases are very possible in the remainder of the year.
How have Midwest prices fared, by comparison. Using the B/C city size category, I obtain the following picture.
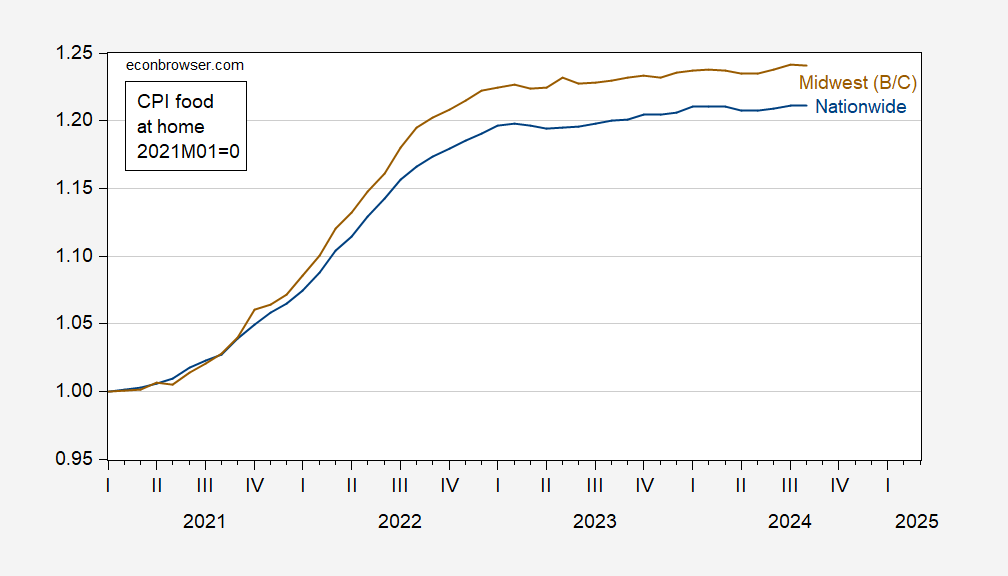
Figure 2: CPI – food at home nationwide (blue), food at home for Midwest (B/C cities) (brown), all normalized to 2020M01=1.00. Midwest at home food CPI component seasonally adjusted by author using X-13 (in logs). Source: BLS, USDA ERS, and author’s calculations.
More By This Author:
Instantaneous Core Inflation, With PPI And Nowcasted PCE DeflatorMackintosh/WSJ: “A Recession Signal Is Flashing Red. Or Is It?”
Six Measures Of Instantaneous Core Inflation


Comments
Log in or sign up to join the conversation.