
The latest update for the weekly Commitment of Traders (COT) report was released by the Commodity Futures Trading Commission (CFTC) on Friday for data ending on January 10th.
This weekly Extreme Positions report highlights the Most Bullish and Most Bearish Positions for the speculator category. Extreme positioning in these markets can foreshadow strong moves in the underlying market.
To signify an extreme position, we use the Strength Index (also known as the COT Index) of each instrument, a common method of measuring COT data. The Strength Index is simply a comparison of current trader positions against the range of positions over the previous 3 years. We use over 80 percent as extremely bullish and under 20 percent as extremely bearish. (Compare Strength Index scores across all markets in the data table or cot leaders table
Here Are This Week’s Most Bullish Speculator Positions:
Soybean Meal
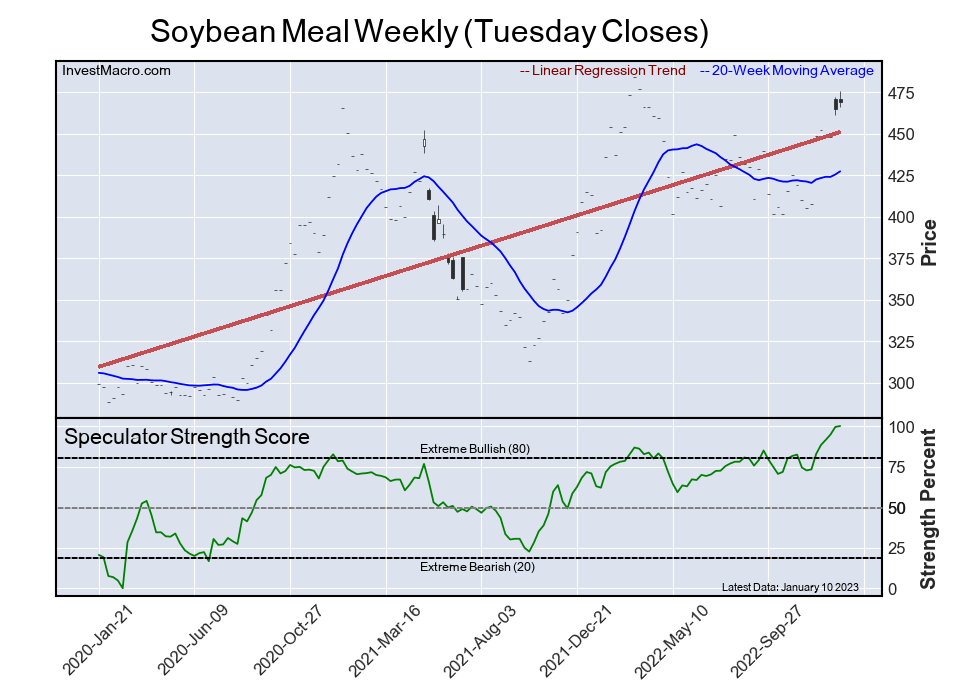
The Soybean Meal speculator position continues to come in as the most bullish extreme standing this week. The Soybean Meal speculator level is currently at a 100.0 percent score of its 3-year range.
The six-week trend for the percent strength score totaled 26.8 this week. The overall net speculator position was a total of 157,710 net contracts this week with a change of 1,142 contract in this week’s speculator bets.
Live Cattle
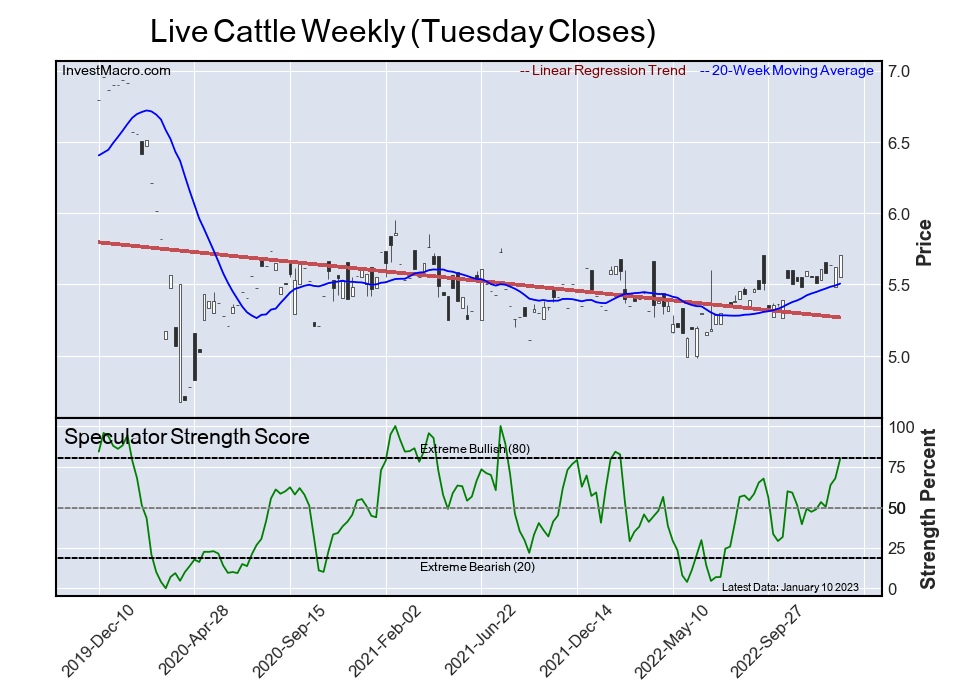
The Live Cattle speculator position comes next in the extreme standings this week. The Live Cattle speculator level is now at a 79.7 percent score of its 3-year range.
The six-week trend for the percent strength score was 32.5 this week. The speculator position registered 79,994 net contracts this week with a weekly gain of 9,505 contracts in speculator bets.
Euro
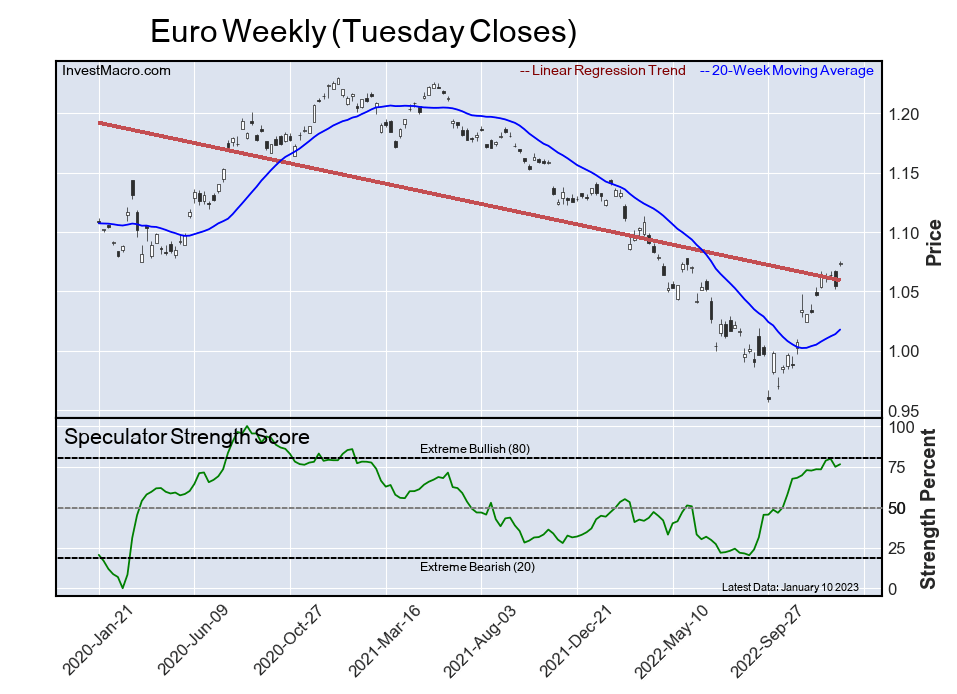
The Euro speculator position comes in third this week in the extreme standings. The Euro speculator level resides at a 76.4 percent score of its 3-year range.
The six-week trend for the speculator strength score came in at 3.9 this week. The overall speculator position was 134,982 net contracts this week with a rise of 5,067 contracts in the weekly speculator bets.
New Zealand Dollar
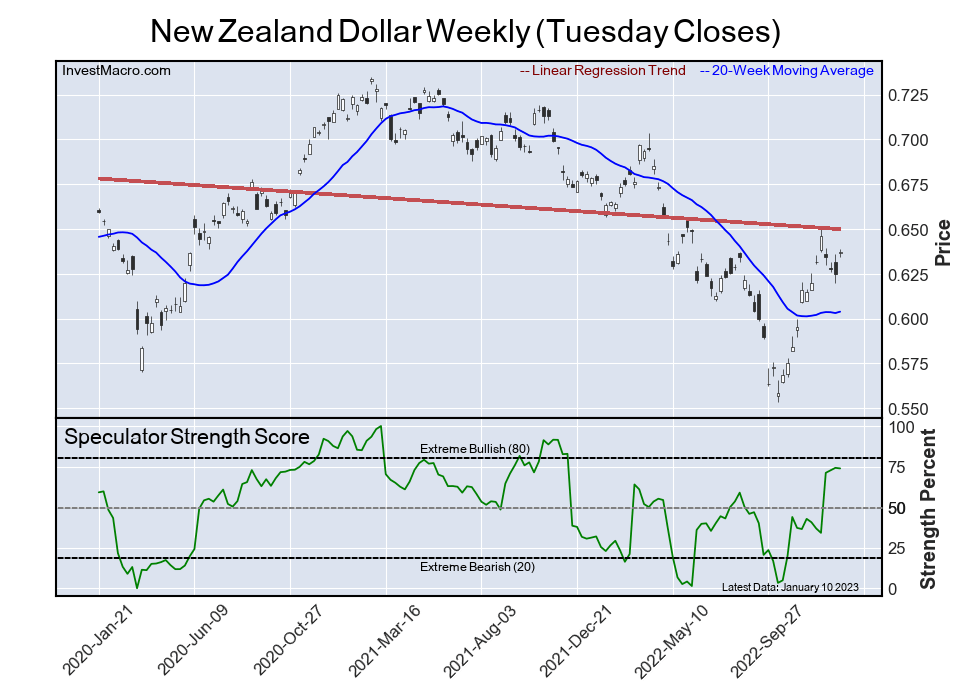
The New Zealand Dollar speculator position comes up number four in the extreme standings this week. The New Zealand Dollar speculator level is at a 73.9 percent score of its 3-year range.
The six-week trend for the speculator strength score totaled a change of 33.2 this week. The overall speculator position was 7,350 net contracts this week with a dip of -130 contracts in the speculator bets.
Nasdaq
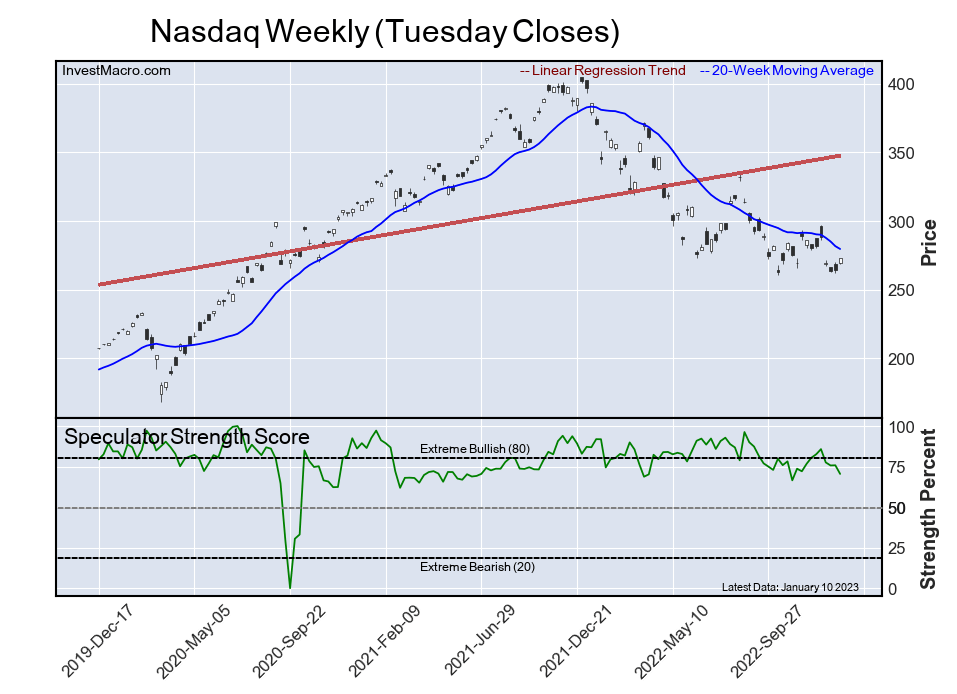
The Nasdaq speculator position rounds out the top five in this week’s bullish extreme standings. The Nasdaq speculator level sits at a 70.5 percent score of its 3-year range. The six-week trend for the speculator strength score was -10.0 this week.
The speculator position was -8,151 net contracts this week with a decline of -9,513 contracts in the weekly speculator bets.
This Week’s Most Bearish Speculator Positions:
WTI Crude Oil
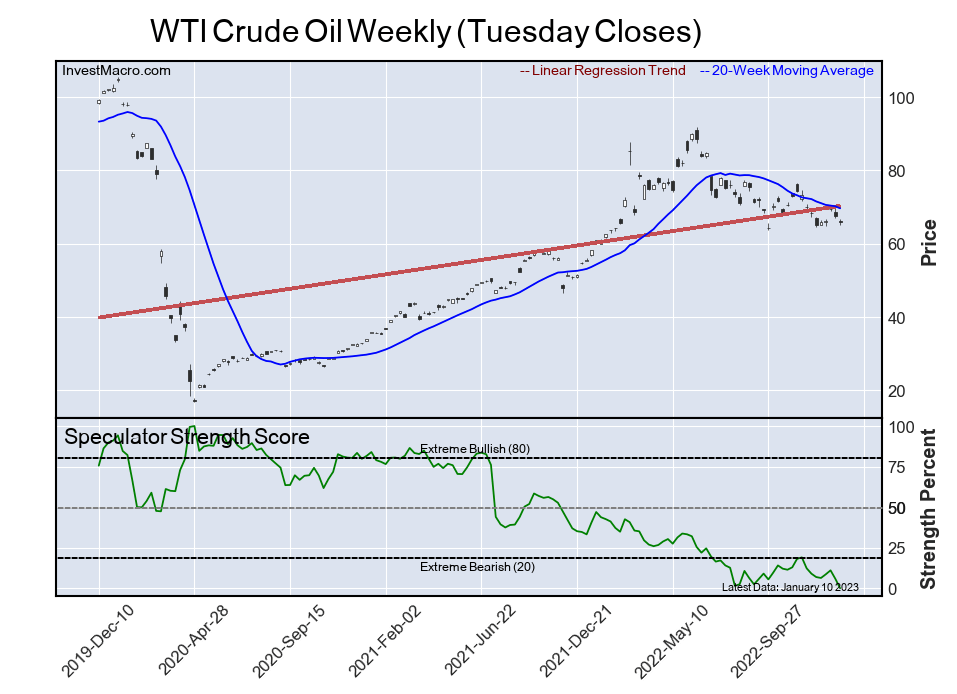
The WTI Crude Oil speculator position comes in as the most bearish extreme standing this week. The WTI Crude Oil speculator level is at a 0.0 percent score of its 3-year range.
The six-week trend for the speculator strength score was -9.0 this week. The overall speculator position was 205,236 net contracts this week with a drop of -22,371 contracts in the speculator bets.
Wheat
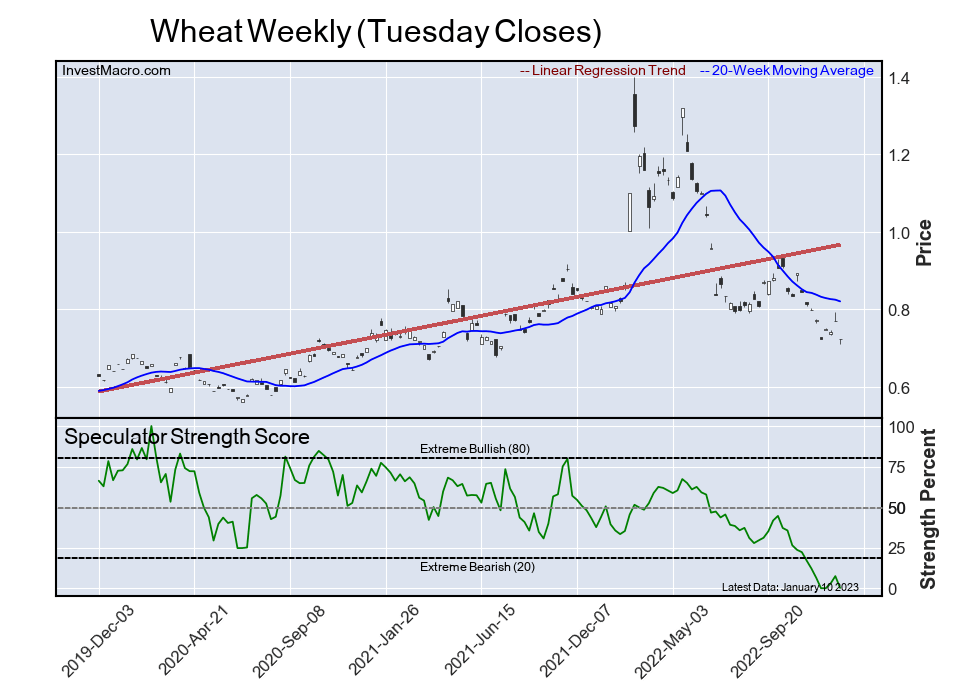
The Wheat speculator position comes in next for the most bearish extreme standing on the week. The Wheat speculator level is at a 0.2 percent score of its 3-year range.
The six-week trend for the speculator strength score was -6.3 this week. The speculator position was -39,716 net contracts this week with a decline of -7,425 contracts in the weekly speculator bets.
Coffee
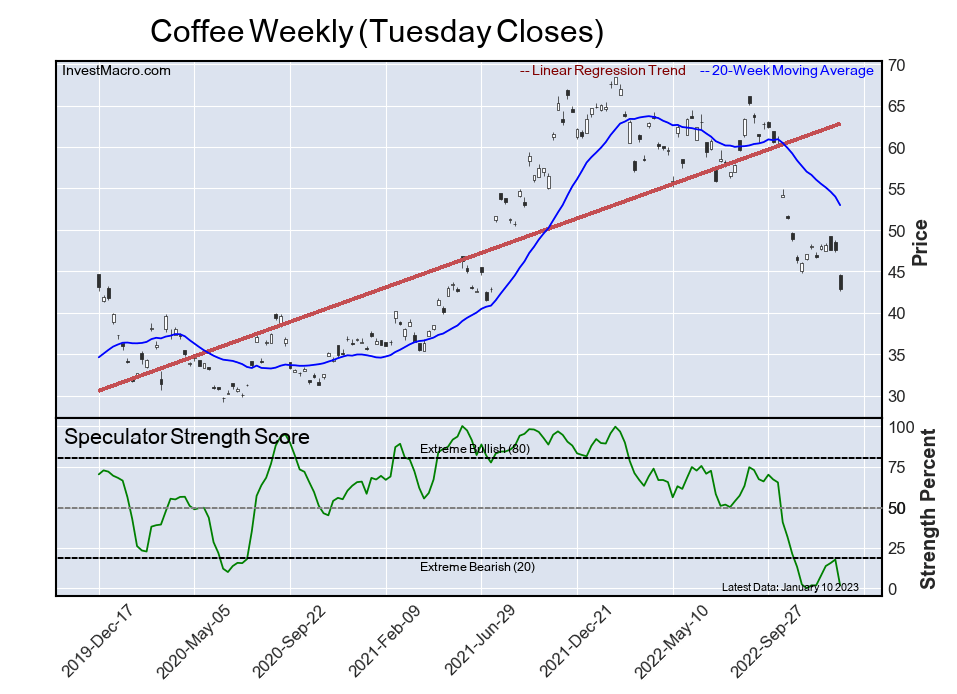
The Coffee speculator position comes in as third most bearish extreme standing of the week. The Coffee speculator level resides at a 1.7 percent score of its 3-year range.
The six-week trend for the speculator strength score was -0.1 this week. The overall speculator position was -14,739 net contracts this week with a shortfall of -13,927 contracts in the speculator bets.
Ultra 10-Year U.S. T-Note

The Ultra 10-Year U.S. T-Note speculator position comes in as this week’s fourth most bearish extreme standing. The Ultra 10-Year U.S. T-Note speculator level is at a 3.9 percent score of its 3-year range.
The six-week trend for the speculator strength score was -4.9 this week. The speculator position was -98,270 net contracts this week with a gain of 15,087 contracts in the weekly speculator bets.
Mexican Peso
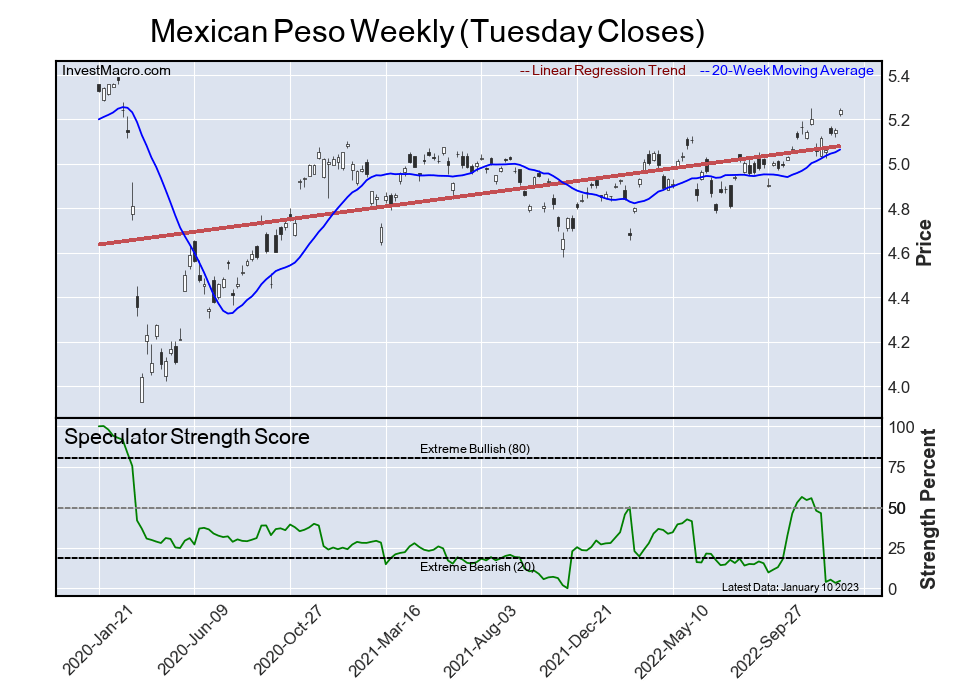
Finally, the Mexican Peso speculator position comes in as the fifth most bearish extreme standing for this week. The Mexican Peso speculator level is at a 4.6 percent score of its 3-year range.
The six-week trend for the speculator strength score was -50.9 this week. The speculator position was -53,381 net contracts this week with a rise of 2,995 contracts in the weekly speculator bets.
Speculators or Non-Commercials Notes:
Speculators, classified as non-commercial traders by the CFTC, are made up of large commodity funds, hedge funds and other significant for-profit participants. The Specs are generally regarded as trend-followers in their behavior towards price action – net speculator bets and prices tend to go in the same directions. These traders often look to buy when prices are rising and sell when prices are falling. To illustrate this point, many times speculator contracts can be found at their most extremes (bullish or bearish) when prices are also close to their highest or lowest levels.
These extreme levels can be dangerous for the large speculators as the trade is most crowded, there is less trading ammunition still sitting on the sidelines to push the trend further and prices have moved a significant distance. When the trend becomes exhausted, some speculators take profits while others look to also exit positions when prices fail to continue in the same direction. This process usually plays out over many months to years and can ultimately create a reverse effect where prices start to fall and speculators start a process of selling when prices are falling.
*COT Report: The COT data, released weekly to the public each Friday, is updated through the most recent Tuesday (data is 3 days old) and shows a quick view of how large speculators or non-commercials (for-profit traders) were positioned in the futures markets.
The CFTC categorizes trader positions according to commercial hedgers (traders who use futures contracts for hedging as part of the business), non-commercials (large traders who speculate to realize trading profits) and nonreportable traders (usually small traders/speculators) as well as their open interest (contracts open in the market at time of reporting). See CFTC criteria here.
More By This Author:
Speculator Extremes: Soybean Meal & Ultra 10-Year Bonds Lead Weekly Bullish & Bearish Positions
Large Currency Speculators Trimmed Euro Bullish Bets
Metals Speculators Push Their Platinum Bullish Bets To 91-Week High


Comments
Log in or sign up to join the conversation.