
Here are the latest charts and statistics for the Commitment of Traders (COT) data published by the Commodities Futures Trading Commission (CFTC).
The latest COT data is updated through Tuesday, July 12th and shows a quick view of how large traders (for-profit speculators and commercial entities) were positioned in the futures markets. All currency positions are in direct relation to the US dollar where, for example, a bet for the euro is a bet that the euro will rise versus the dollar while a bet against the euro will be a bet that the euro will decline versus the dollar.
Weekly Speculator Changes
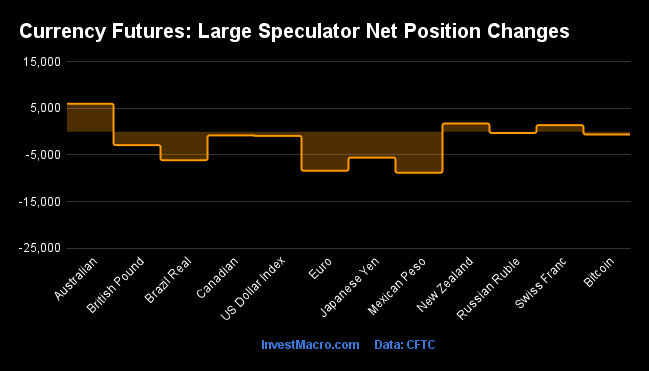
COT currency market speculator bets were mostly lower this week as just three out of the eleven currency markets we cover had higher positioning while the other eight markets had lower speculator contracts.
Leading the gains for the currency markets was the Australian dollar with a weekly gain of 6,021 contracts while the New Zealand dollar (1,773 contracts) and the Swiss franc (1,411 contracts) also had positive weeks.
The currencies leading the declines in speculator bets this week were the Mexican peso (-8,820 contracts) and the Euro (-8,392 contracts) with the Brazilian real (-6,128 contracts), Japanese yen (-5,553 contracts), British pound sterling (-2,881 contracts), US Dollar Index (-897 contracts), Canadian dollar (-788 contracts) and Bitcoin(-591 contracts) also registering lower bets on the week.
Highlighting this week’s COT currency data is the continued decline in the Euro speculator positions which fell for a second straight week and for the fifth time in the past six weeks. Euro bets have now dropped by -77,516 contracts in just the past six weeks, going from +52,272 contracts on May 31st to -25,244 contracts this week. This weakness put the current speculator position at the lowest level since March of 2020 but it is nowhere near the extremely bearish levels of years past (for example: -114,021 contracts in 2020 or -182,845 contracts in 2015). There seems to be a lot of room for the speculator position to fall further.
Will this bring the Euro price even lower? That is a fascinating question as the largest currency news story of the past few weeks has been the EURUSD reaching parity for the first time in over twenty years. The EURUSD actually hit 0.9952 on Thursday before closing the week near the 1.0080 exchange rate and with the US Federal Reserve poised to raise interest rates further soon – the EURUSD will likely remain under pressure but how low can it go?
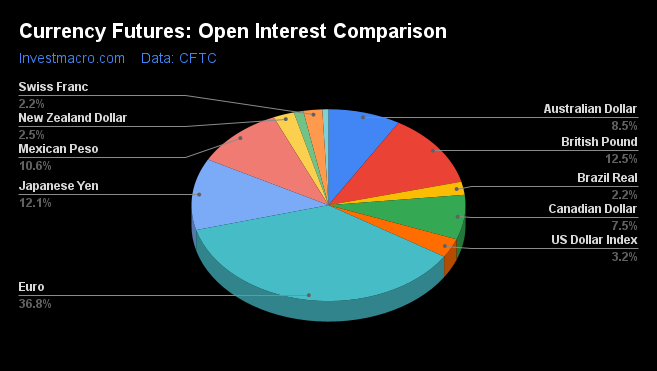
The other side of the COT data this week is the continued strength of the US Dollar Index speculator positions. The USD Index speculator bets fell this week for a third straight week but remain very much near their recent highs. Speculative positions recently had three straight weeks of over at least +40,000 net contracts for the first time since 2019 while the speculator position also topped +45,000 contracts (on June 21st) for the first time since March 21st of 2017, a span of 274 weeks. The strong sentiment for the dollar has helped boost the US Dollar Index price to a high over 109.00 this week, reaching the highest level since 2002. With the two largest components of the US Dollar Index, the Euro at 57.6 percent of the index and the Japanese yen at 13.6 percent, so weak at the moment, the DXY might challenge the 110 exchange rate in the weeks to come.
Data Snapshot of Forex Market Traders | Columns Legend
| EUR | 682,031 | 75 | -25,244 | 27 | 5,760 | 78 | 19,484 | 7 |
| GBP | 231,945 | 59 | -59,089 | 31 | 75,405 | 74 | -16,316 | 22 |
| JPY | 223,539 | 71 | -59,998 | 32 | 75,067 | 72 | -15,069 | 23 |
| MXN | 195,611 | 47 | -23,238 | 17 | 20,317 | 81 | 2,921 | 55 |
| AUD | 158,263 | 51 | -41,600 | 46 | 52,490 | 58 | -10,890 | 26 |
| CAD | 139,297 | 23 | 3,505 | 43 | -4,653 | 65 | 1,148 | 32 |
| USD Index | 59,565 | 88 | 38,354 | 89 | -40,895 | 11 | 2,541 | 44 |
| NZD | 45,837 | 36 | -5,283 | 62 | 8,979 | 44 | -3,696 | 9 |
| CHF | 41,255 | 23 | -8,724 | 34 | 19,882 | 75 | -11,158 | 20 |
| BRL | 41,034 | 28 | 10,205 | 60 | -10,868 | 41 | 663 | 73 |
| RUB | 20,930 | 4 | 7,543 | 31 | -7,150 | 69 | -393 | 24 |
| Bitcoin | 13,505 | 77 | -171 | 77 | -201 | 0 | 372 | 21 |
Strength Scores
Strength Scores (a normalized measure of Speculator positions over a 3-Year range, from 0 to 100 where above 80 is extreme bullish and below 20 is extreme bearish) show that the US Dollar Index (88.9 percent) leads the currency markets near the top of its 3-year range and in a bullish extreme position (above 80 percent). Bitcoin (77.2 percent) comes in as the next highest in the currency markets strength scores with the New Zealand Dollar (62.4 percent) and the Brazilian Real (60.4 percent) rounding out the only other markets above 50 percent or above their midpoint for the past 3 years . On the downside, the Mexican Peso (17.4 percent) comes in at the lowest strength level currently and the only one in a bearish extreme level. The EuroFX (27.3 percent) continues to fall and is the second lowest strength score this week.

Strength Statistics:
US Dollar Index (88.9 percent) vs US Dollar Index previous week (90.4 percent)
EuroFX (27.3 percent) vs EuroFX previous week (29.8 percent)
British Pound Sterling (31.4 percent) vs British Pound Sterling previous week (33.5 percent)
Japanese Yen (31.9 percent) vs Japanese Yen previous week (35.3 percent)
Swiss Franc (34.4 percent) vs Swiss Franc previous week (30.8 percent)
Canadian Dollar (43.3 percent) vs Canadian Dollar previous week (44.2 percent)
Australian Dollar (46.3 percent) vs Australian Dollar previous week (40.7 percent)
New Zealand Dollar (62.4 percent) vs New Zealand Dollar previous week (59.4 percent)
Mexican Peso (17.4 percent) vs Mexican Peso previous week (21.2 percent)
Brazil Real (60.4 percent) vs Brazil Real previous week (66.4 percent)
Russian Ruble (31.2 percent) vs Russian Ruble previous week (31.9 percent)
Bitcoin (77.2 percent) vs Bitcoin previous week (87.9 percent)
Strength Trends
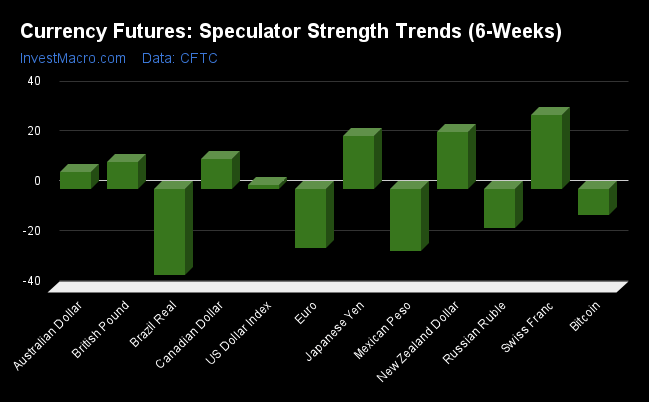
Strength Score Trends (or move index, calculates the 6-week changes in strength scores) show that the Swiss Franc (29.7 percent) leads the past six weeks trends for the currency markets this week. The New Zealand Dollar (22.6 percent) and the Japanese Yen (21.2 percent) round out the next highest movers in the latest trends data as the CHF, NZD and the JPY have seen improving sentiment from speculators. The Brazilian Real (-34.5 percent) leads the downside trend scores this week while the next markets with lower trend scores were the Mexican Peso (-25.0 percent) followed by the Euro (-23.8 percent).
Strength Trend Statistics:
US Dollar Index (1.4 percent) vs US Dollar Index previous week (2.0 percent)
EuroFX (-23.8 percent) vs EuroFX previous week (-17.1 percent)
British Pound Sterling (10.8 percent) vs British Pound Sterling previous week (17.4 percent)
Japanese Yen (21.2 percent) vs Japanese Yen previous week (27.7 percent)
Swiss Franc (29.7 percent) vs Swiss Franc previous week (24.2 percent)
Canadian Dollar (11.8 percent) vs Canadian Dollar previous week (19.1 percent)
Australian Dollar (6.6 percent) vs Australian Dollar previous week (-2.0 percent)
New Zealand Dollar (22.6 percent) vs New Zealand Dollar previous week (20.6 percent)
Mexican Peso (-25.0 percent) vs Mexican Peso previous week (-18.9 percent)
Brazil Real (-34.5 percent) vs Brazil Real previous week (-22.0 percent)
Russian Ruble (-15.6 percent) vs Russian Ruble previous week (9.1 percent)
Bitcoin (-10.4 percent) vs Bitcoin previous week (-7.8 percent)
Individual Markets:
US Dollar Index Futures:

The US Dollar Index large speculator standing this week totaled a net position of 38,354 contracts in the data reported through Tuesday. This was a weekly fall of -897 contracts from the previous week which had a total of 39,251 net contracts.
This week’s current strength score (the trader positioning range over the past three years, measured from 0 to 100) shows the speculators are currently Bullish-Extreme with a score of 88.9 percent. The commercials are Bearish-Extreme with a score of 10.9 percent and the small traders (not shown in chart) are Bearish with a score of 44.3 percent.
| US DOLLAR INDEX Statistics | SPECULATORS | COMMERCIALS | SMALL TRADERS |
| – Percent of Open Interest Longs: | 85.8 | 3.9 | 9.0 |
| – Percent of Open Interest Shorts: | 21.4 | 72.5 | 4.7 |
| – Net Position: | 38,354 | -40,895 | 2,541 |
| – Gross Longs: | 51,109 | 2,305 | 5,365 |
| – Gross Shorts: | 12,755 | 43,200 | 2,824 |
| – Long to Short Ratio: | 4.0 to 1 | 0.1 to 1 | 1.9 to 1 |
| NET POSITION TREND: | |||
| – Strength Index Score (3 Year Range Pct): | 88.9 | 10.9 | 44.3 |
| – Strength Index Reading (3 Year Range): | Bullish-Extreme | Bearish-Extreme | Bearish |
| NET POSITION MOVEMENT INDEX: | |||
| – 6-Week Change in Strength Index: | 1.4 | 0.7 | -13.7 |
Euro Currency Futures:
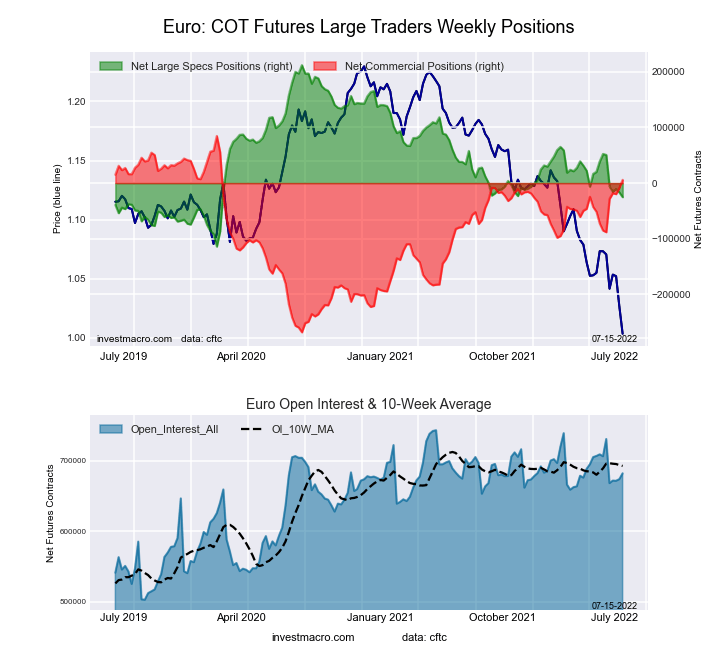
The Euro Currency large speculator standing this week totaled a net position of -25,244 contracts in the data reported through Tuesday. This was a weekly reduction of -8,392 contracts from the previous week which had a total of -16,852 net contracts.
This week’s current strength score (the trader positioning range over the past three years, measured from 0 to 100) shows the speculators are currently Bearish with a score of 27.3 percent. The commercials are Bullish with a score of 77.7 percent and the small traders (not shown in chart) are Bearish-Extreme with a score of 6.7 percent.
| EURO Currency Statistics | SPECULATORS | COMMERCIALS | SMALL TRADERS |
| – Percent of Open Interest Longs: | 28.9 | 56.5 | 12.2 |
| – Percent of Open Interest Shorts: | 32.6 | 55.6 | 9.4 |
| – Net Position: | -25,244 | 5,760 | 19,484 |
| – Gross Longs: | 197,240 | 385,039 | 83,394 |
| – Gross Shorts: | 222,484 | 379,279 | 63,910 |
| – Long to Short Ratio: | 0.9 to 1 | 1.0 to 1 | 1.3 to 1 |
| NET POSITION TREND: | |||
| – Strength Index Score (3 Year Range Pct): | 27.3 | 77.7 | 6.7 |
| – Strength Index Reading (3 Year Range): | Bearish | Bullish | Bearish-Extreme |
| NET POSITION MOVEMENT INDEX: | |||
| – 6-Week Change in Strength Index: | -23.8 | 25.8 | -22.2 |
British Pound Sterling Futures:
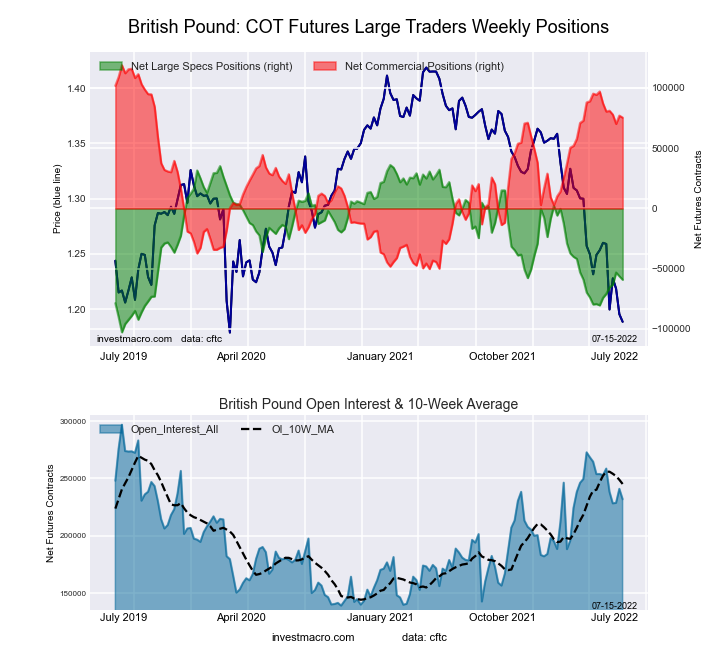
The British Pound Sterling large speculator standing this week totaled a net position of -59,089 contracts in the data reported through Tuesday. This was a weekly reduction of -2,881 contracts from the previous week which had a total of -56,208 net contracts.
This week’s current strength score (the trader positioning range over the past three years, measured from 0 to 100) shows the speculators are currently Bearish with a score of 31.4 percent. The commercials are Bullish with a score of 74.3 percent and the small traders (not shown in chart) are Bearish with a score of 21.8 percent.
| BRITISH POUND Statistics | SPECULATORS | COMMERCIALS | SMALL TRADERS |
| – Percent of Open Interest Longs: | 14.6 | 75.3 | 8.2 |
| – Percent of Open Interest Shorts: | 40.1 | 42.8 | 15.2 |
| – Net Position: | -59,089 | 75,405 | -16,316 |
| – Gross Longs: | 33,850 | 174,748 | 18,999 |
| – Gross Shorts: | 92,939 | 99,343 | 35,315 |
| – Long to Short Ratio: | 0.4 to 1 | 1.8 to 1 | 0.5 to 1 |
| NET POSITION TREND: | |||
| – Strength Index Score (3 Year Range Pct): | 31.4 | 74.3 | 21.8 |
| – Strength Index Reading (3 Year Range): | Bearish | Bullish | Bearish |
| NET POSITION MOVEMENT INDEX: | |||
| – 6-Week Change in Strength Index: | 10.8 | -7.0 | -6.7 |
Japanese Yen Futures:
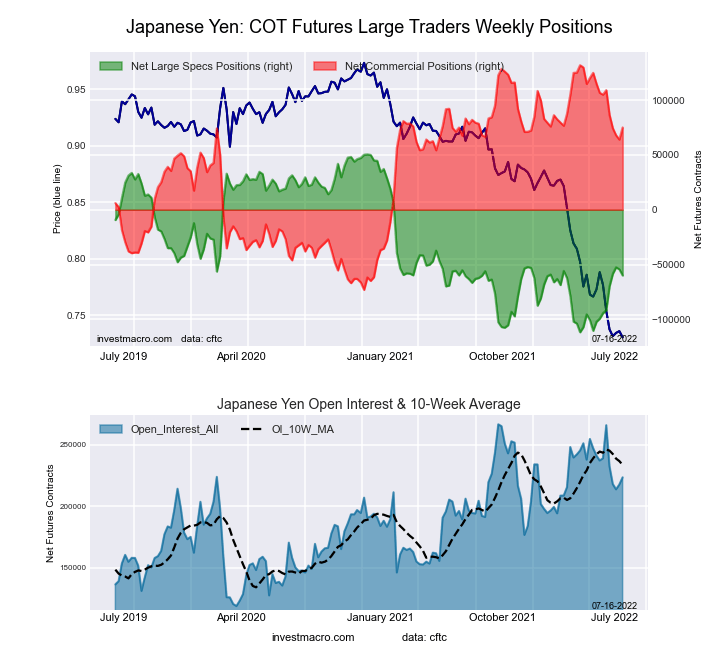
The Japanese Yen large speculator standing this week totaled a net position of -59,998 contracts in the data reported through Tuesday. This was a weekly decline of -5,553 contracts from the previous week which had a total of -54,445 net contracts.
This week’s current strength score (the trader positioning range over the past three years, measured from 0 to 100) shows the speculators are currently Bearish with a score of 31.9 percent. The commercials are Bullish with a score of 72.3 percent and the small traders (not shown in chart) are Bearish with a score of 22.8 percent.
| JAPANESE YEN Statistics | SPECULATORS | COMMERCIALS | SMALL TRADERS |
| – Percent of Open Interest Longs: | 15.9 | 71.8 | 10.4 |
| – Percent of Open Interest Shorts: | 42.7 | 38.3 | 17.1 |
| – Net Position: | -59,998 | 75,067 | -15,069 |
| – Gross Longs: | 35,533 | 160,589 | 23,147 |
| – Gross Shorts: | 95,531 | 85,522 | 38,216 |
| – Long to Short Ratio: | 0.4 to 1 | 1.9 to 1 | 0.6 to 1 |
| NET POSITION TREND: | |||
| – Strength Index Score (3 Year Range Pct): | 31.9 | 72.3 | 22.8 |
| – Strength Index Reading (3 Year Range): | Bearish | Bullish | Bearish |
| NET POSITION MOVEMENT INDEX: | |||
| – 6-Week Change in Strength Index: | 21.2 | -14.6 | -9.1 |
Swiss Franc Futures:
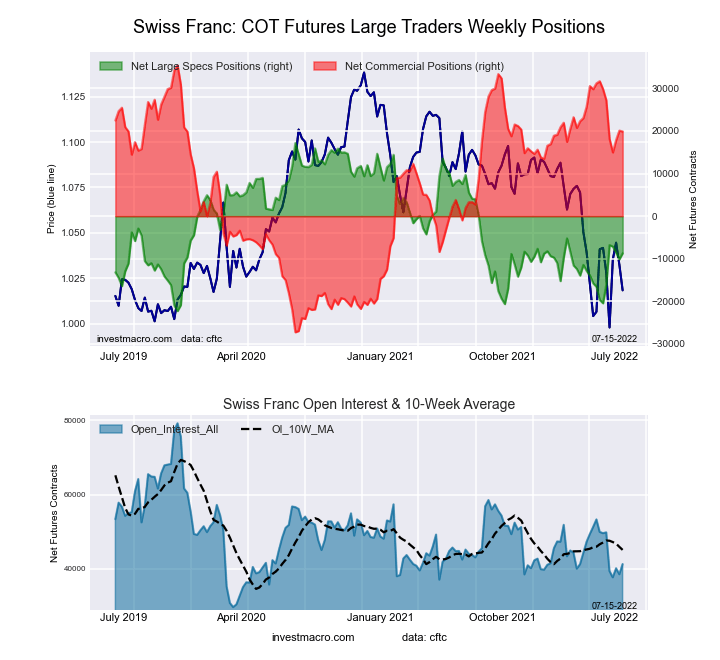
The Swiss Franc large speculator standing this week totaled a net position of -8,724 contracts in the data reported through Tuesday. This was a weekly rise of 1,411 contracts from the previous week which had a total of -10,135 net contracts.
This week’s current strength score (the trader positioning range over the past three years, measured from 0 to 100) shows the speculators are currently Bearish with a score of 34.4 percent. The commercials are Bullish with a score of 75.2 percent and the small traders (not shown in chart) are Bearish-Extreme with a score of 19.8 percent.
| SWISS FRANC Statistics | SPECULATORS | COMMERCIALS | SMALL TRADERS |
| – Percent of Open Interest Longs: | 17.0 | 63.5 | 19.4 |
| – Percent of Open Interest Shorts: | 38.2 | 15.4 | 46.4 |
| – Net Position: | -8,724 | 19,882 | -11,158 |
| – Gross Longs: | 7,017 | 26,217 | 7,984 |
| – Gross Shorts: | 15,741 | 6,335 | 19,142 |
| – Long to Short Ratio: | 0.4 to 1 | 4.1 to 1 | 0.4 to 1 |
| NET POSITION TREND: | |||
| – Strength Index Score (3 Year Range Pct): | 34.4 | 75.2 | 19.8 |
| – Strength Index Reading (3 Year Range): | Bearish | Bullish | Bearish-Extreme |
| NET POSITION MOVEMENT INDEX: | |||
| – 6-Week Change in Strength Index: | 29.7 | -15.9 | -6.0 |
Canadian Dollar Futures:
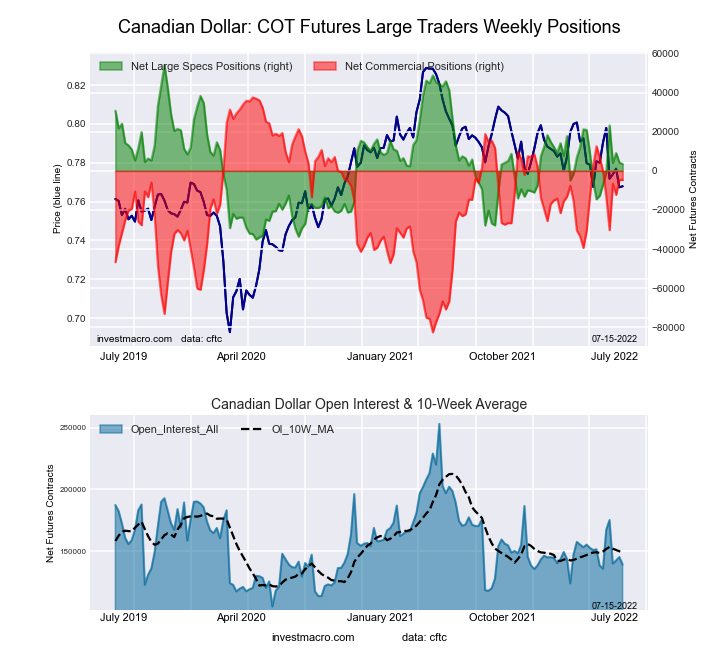
The Canadian Dollar large speculator standing this week totaled a net position of 3,505 contracts in the data reported through Tuesday. This was a weekly decrease of -788 contracts from the previous week which had a total of 4,293 net contracts.
This week’s current strength score (the trader positioning range over the past three years, measured from 0 to 100) shows the speculators are currently Bearish with a score of 43.3 percent. The commercials are Bullish with a score of 64.9 percent and the small traders (not shown in chart) are Bearish with a score of 32.4 percent.
| CANADIAN DOLLAR Statistics | SPECULATORS | COMMERCIALS | SMALL TRADERS |
| – Percent of Open Interest Longs: | 29.9 | 46.4 | 22.9 |
| – Percent of Open Interest Shorts: | 27.4 | 49.8 | 22.0 |
| – Net Position: | 3,505 | -4,653 | 1,148 |
| – Gross Longs: | 41,613 | 64,673 | 31,834 |
| – Gross Shorts: | 38,108 | 69,326 | 30,686 |
| – Long to Short Ratio: | 1.1 to 1 | 0.9 to 1 | 1.0 to 1 |
| NET POSITION TREND: | |||
| – Strength Index Score (3 Year Range Pct): | 43.3 | 64.9 | 32.4 |
| – Strength Index Reading (3 Year Range): | Bearish | Bullish | Bearish |
| NET POSITION MOVEMENT INDEX: | |||
| – 6-Week Change in Strength Index: | 11.8 | -3.6 | -12.4 |
Australian Dollar Futures:

The Australian Dollar large speculator standing this week totaled a net position of -41,600 contracts in the data reported through Tuesday. This was a weekly gain of 6,021 contracts from the previous week which had a total of -47,621 net contracts.
This week’s current strength score (the trader positioning range over the past three years, measured from 0 to 100) shows the speculators are currently Bearish with a score of 46.3 percent. The commercials are Bullish with a score of 58.0 percent and the small traders (not shown in chart) are Bearish with a score of 25.9 percent.
| AUSTRALIAN DOLLAR Statistics | SPECULATORS | COMMERCIALS | SMALL TRADERS |
| – Percent of Open Interest Longs: | 19.3 | 67.0 | 10.5 |
| – Percent of Open Interest Shorts: | 45.6 | 33.9 | 17.4 |
| – Net Position: | -41,600 | 52,490 | -10,890 |
| – Gross Longs: | 30,527 | 106,112 | 16,570 |
| – Gross Shorts: | 72,127 | 53,622 | 27,460 |
| – Long to Short Ratio: | 0.4 to 1 | 2.0 to 1 | 0.6 to 1 |
| NET POSITION TREND: | |||
| – Strength Index Score (3 Year Range Pct): | 46.3 | 58.0 | 25.9 |
| – Strength Index Reading (3 Year Range): | Bearish | Bullish | Bearish |
| NET POSITION MOVEMENT INDEX: | |||
| – 6-Week Change in Strength Index: | 6.6 | 1.0 | -20.6 |
New Zealand Dollar Futures:
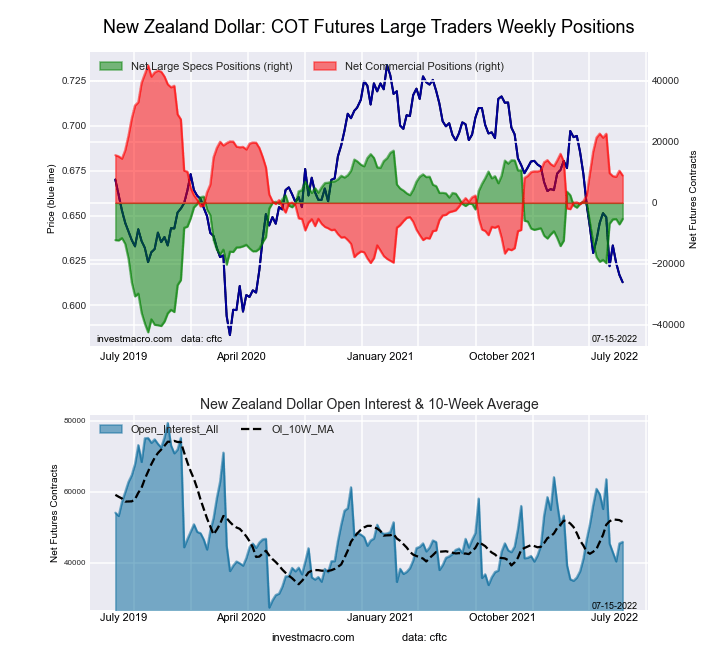
The New Zealand Dollar large speculator standing this week totaled a net position of -5,283 contracts in the data reported through Tuesday. This was a weekly gain of 1,773 contracts from the previous week which had a total of -7,056 net contracts.
This week’s current strength score (the trader positioning range over the past three years, measured from 0 to 100) shows the speculators are currently Bullish with a score of 62.4 percent. The commercials are Bearish with a score of 44.2 percent and the small traders (not shown in chart) are Bearish-Extreme with a score of 9.2 percent.
| NEW ZEALAND DOLLAR Statistics | SPECULATORS | COMMERCIALS | SMALL TRADERS |
| – Percent of Open Interest Longs: | 32.6 | 61.7 | 5.3 |
| – Percent of Open Interest Shorts: | 44.1 | 42.1 | 13.4 |
| – Net Position: | -5,283 | 8,979 | -3,696 |
| – Gross Longs: | 14,926 | 28,261 | 2,436 |
| – Gross Shorts: | 20,209 | 19,282 | 6,132 |
| – Long to Short Ratio: | 0.7 to 1 | 1.5 to 1 | 0.4 to 1 |
| NET POSITION TREND: | |||
| – Strength Index Score (3 Year Range Pct): | 62.4 | 44.2 | 9.2 |
| – Strength Index Reading (3 Year Range): | Bullish | Bearish | Bearish-Extreme |
| NET POSITION MOVEMENT INDEX: | |||
| – 6-Week Change in Strength Index: | 22.6 | -19.1 | -12.0 |
Mexican Peso Futures:
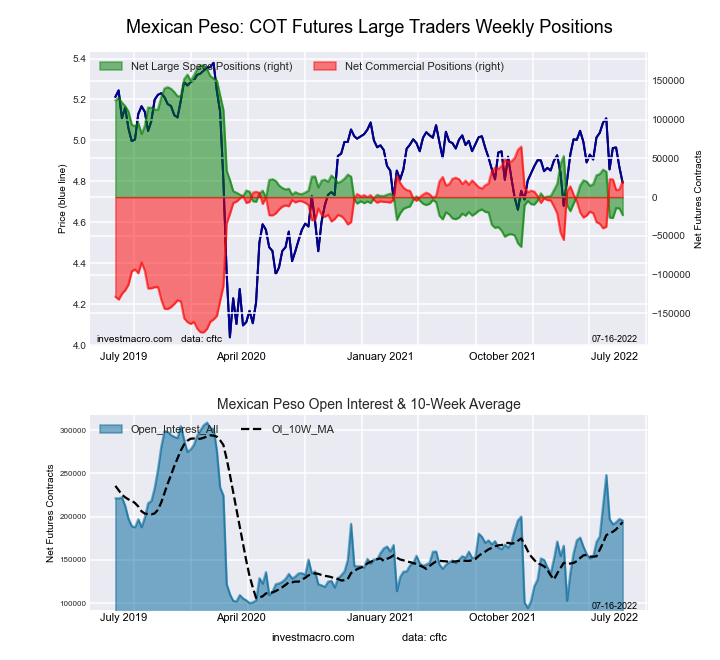
The Mexican Peso large speculator standing this week totaled a net position of -23,238 contracts in the data reported through Tuesday. This was a weekly lowering of -8,820 contracts from the previous week which had a total of -14,418 net contracts.
This week’s current strength score (the trader positioning range over the past three years, measured from 0 to 100) shows the speculators are currently Bearish-Extreme with a score of 17.4 percent. The commercials are Bullish-Extreme with a score of 81.3 percent and the small traders (not shown in chart) are Bullish with a score of 55.4 percent.
| MEXICAN PESO Statistics | SPECULATORS | COMMERCIALS | SMALL TRADERS |
| – Percent of Open Interest Longs: | 53.5 | 43.1 | 3.1 |
| – Percent of Open Interest Shorts: | 65.4 | 32.7 | 1.6 |
| – Net Position: | -23,238 | 20,317 | 2,921 |
| – Gross Longs: | 104,715 | 84,247 | 6,023 |
| – Gross Shorts: | 127,953 | 63,930 | 3,102 |
| – Long to Short Ratio: | 0.8 to 1 | 1.3 to 1 | 1.9 to 1 |
| NET POSITION TREND: | |||
| – Strength Index Score (3 Year Range Pct): | 17.4 | 81.3 | 55.4 |
| – Strength Index Reading (3 Year Range): | Bearish-Extreme | Bullish-Extreme | Bullish |
| NET POSITION MOVEMENT INDEX: | |||
| – 6-Week Change in Strength Index: | -25.0 | 25.2 | -7.5 |
Brazilian Real Futures:
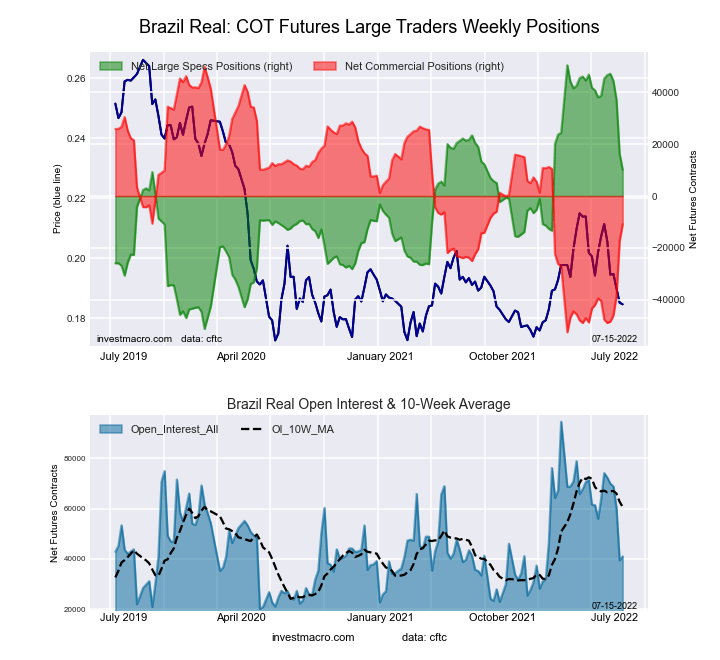
The Brazilian Real large speculator standing this week totaled a net position of 10,205 contracts in the data reported through Tuesday. This was a weekly decline of -6,128 contracts from the previous week which had a total of 16,333 net contracts.
This week’s current strength score (the trader positioning range over the past three years, measured from 0 to 100) shows the speculators are currently Bullish with a score of 60.4 percent. The commercials are Bearish with a score of 40.7 percent and the small traders (not shown in chart) are Bullish with a score of 72.5 percent.
| BRAZIL REAL Statistics | SPECULATORS | COMMERCIALS | SMALL TRADERS |
| – Percent of Open Interest Longs: | 46.8 | 46.0 | 7.2 |
| – Percent of Open Interest Shorts: | 21.9 | 72.5 | 5.6 |
| – Net Position: | 10,205 | -10,868 | 663 |
| – Gross Longs: | 19,197 | 18,878 | 2,957 |
| – Gross Shorts: | 8,992 | 29,746 | 2,294 |
| – Long to Short Ratio: | 2.1 to 1 | 0.6 to 1 | 1.3 to 1 |
| NET POSITION TREND: | |||
| – Strength Index Score (3 Year Range Pct): | 60.4 | 40.7 | 72.5 |
| – Strength Index Reading (3 Year Range): | Bullish | Bearish | Bullish |
| NET POSITION MOVEMENT INDEX: | |||
| – 6-Week Change in Strength Index: | -34.5 | 35.9 | -19.8 |
Bitcoin Futures:

The Bitcoin large speculator standing this week totaled a net position of -171 contracts in the data reported through Tuesday. This was a weekly decline of -591 contracts from the previous week which had a total of 420 net contracts.
This week’s current strength score (the trader positioning range over the past three years, measured from 0 to 100) shows the speculators are currently Bullish with a score of 77.2 percent. The commercials are Bearish with a score of 46.1 percent and the small traders (not shown in chart) are Bearish with a score of 21.4 percent.
| BITCOIN Statistics | SPECULATORS | COMMERCIALS | SMALL TRADERS |
| – Percent of Open Interest Longs: | 76.5 | 1.6 | 9.2 |
| – Percent of Open Interest Shorts: | 77.7 | 3.1 | 6.5 |
| – Net Position: | -171 | -201 | 372 |
| – Gross Longs: | 10,325 | 216 | 1,247 |
| – Gross Shorts: | 10,496 | 417 | 875 |
| – Long to Short Ratio: | 1.0 to 1 | 0.5 to 1 | 1.4 to 1 |
| NET POSITION TREND: | |||
| – Strength Index Score (3 Year Range Pct): | 77.2 | 46.1 | 21.4 |
| – Strength Index Reading (3 Year Range): | Bullish | Bearish | Bearish |
| NET POSITION MOVEMENT INDEX: | |||
| – 6-Week Change in Strength Index: | -10.4 | 17.5 | 6.2 |
*COT Report: The COT data, released weekly to the public each Friday, is updated through the most recent Tuesday (data is 3 days old) and shows a quick view of how large speculators or non-commercials (for-profit traders) were positioned in the futures markets.
The CFTC categorizes trader positions according to commercial hedgers (traders who use futures contracts for hedging as part of the business), non-commercials (large traders who speculate to realize trading profits) and nonreportable traders (usually small traders/speculators) as well as their open interest (contracts open in the market at time of reporting).See CFTC criteria here.
More By This Author:
COT Week 27 Charts: Soft Commodities Speculators Bets Go Lower Led By Corn, Sugar & Cocoa
COT Week 27 Charts: Bond Market Speculators Bets Higher Overall Led By Ultra US Bonds & 2-Year Bonds
COT Week 27 Charts: Energy Speculator Bets Drop Led By WTI Crude Oil & Gasoline


Comments
Log in or sign up to join the conversation.