

Here are the latest charts and statistics for the Commitment of Traders (COT) data published by the Commodities Futures Trading Commission (CFTC).
The latest COT data is updated through Tuesday July 5th and shows a quick view of how large traders (for-profit speculators and commercial entities) were positioned in the futures markets.
COT bonds market speculator bets were mostly higher this week as five out of the eight bond markets we cover had higher positioning this week while three markets had lower contracts.
Leading the gains for the bond markets was the Ultra US Bond (19,328 contracts) and the 2-Year Bond (15,076 contracts) with the 10-Year Bond (11,180 contracts), the Long US Bond (10,580 contracts) and the Ultra 10-Year (3,338 contracts) also having positive weeks. Meanwhile, leading the declines in speculator bets this week were the Eurodollar (-192,721 contracts) and the 5-Year Bond (-51,789 contracts) with the Fed Funds (-24,396 contracts) also registering lower bets on the week.

Strength scores (measuring the 3-Year range of Speculator positions, from 0 to 100 where above 80 is extreme bullish and below 20 is extreme bearish) show that the US Treasury Bond (75.6 percent) is at the highest level of the bonds markets again this week followed by the 2-Year Bond (64.7 percent) and the Ultra US Treasury Bond (55.2 percent). On the lower end, the 3-Month Eurodollars (9.7 percent) is the weakest bond market among the speculators and is in a bearish-extreme level again this week. The Ultra 10-Year Bonds (22.9 percent) comes in as the next weakest speculator strength score at the moment but has been on the rise (see chart below) and has come out of the bearish extreme level of the past few weeks.

Strength score trends (or move index, that calculate 6-week changes in strength scores) shows that the Ultra 10-Year Bonds (19.8 percent), the 3-Month Eurodollars (8.9 percent) and the 10-Year Bonds (8.3 percent) are leading the rising trend scores over the past six weeks. The 5-Year Bonds (-23.5 percent) and the US Treasury Bond (-18.3 percent) leads the trends on the downside while the 2-Year Bonds (-10.5 percent) and the Ultra US Treasury Bond (-4.4 percent) also show negative six-week trends.
Data Snapshot of Bond Market Traders | Columns Legend
| Eurodollar | 9,569,471 | 14 | -2,349,151 | 10 | 2,628,720 | 88 | -279,569 | 43 |
| 5-Year | 4,013,995 | 52 | -254,453 | 39 | 404,953 | 63 | -150,500 | 40 |
| 10-Year | 3,469,680 | 28 | -170,500 | 47 | 303,820 | 58 | -133,320 | 48 |
| 2-Year | 2,103,356 | 14 | -87,042 | 65 | 171,591 | 57 | -84,549 | 13 |
| FedFunds | 1,599,372 | 47 | 96,186 | 51 | -88,543 | 49 | -7,643 | 40 |
| Long T-Bond | 1,192,980 | 47 | -27,673 | 76 | 22,028 | 18 | 5,645 | 57 |
3-Month Eurodollars Futures:
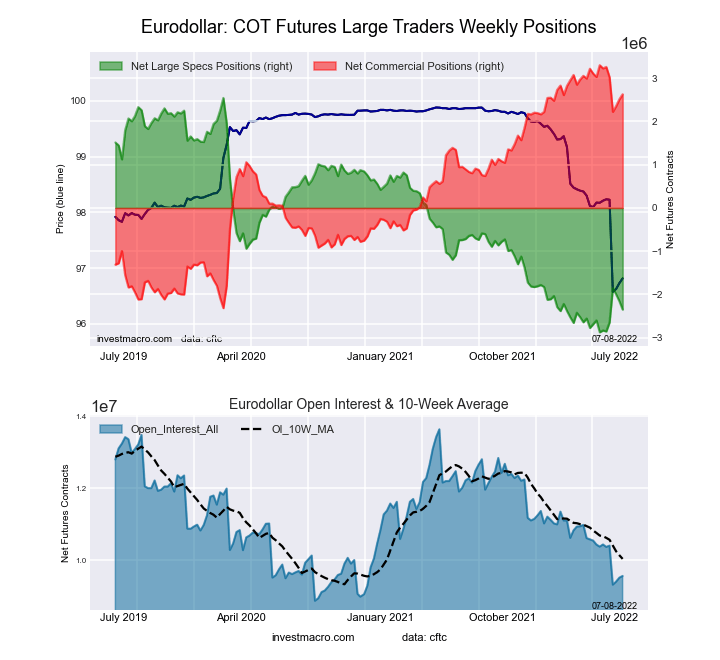 The 3-Month Eurodollars large speculator standing this week was a net position of -2,349,151 contracts in the data reported through Tuesday. This was a weekly fall of -192,721 contracts from the previous week which had a total of -2,156,430 net contracts.
This week’s current strength score (the trader positioning range over the past three years, measured from 0 to 100) shows the speculators are currently Bearish-Extreme with a score of 9.7 percent. The commercials are Bullish-Extreme with a score of 88.0 percent and the small traders (not shown in chart) are Bearish with a score of 42.9 percent.
| 3-Month Eurodollars Statistics | SPECULATORS | COMMERCIALS | SMALL TRADERS |
| – Percent of Open Interest Longs: | 5.8 | 71.0 | 4.4 |
| – Percent of Open Interest Shorts: | 30.4 | 43.6 | 7.4 |
| – Net Position: | -2,349,151 | 2,628,720 | -279,569 |
| – Gross Longs: | 557,177 | 6,798,600 | 424,934 |
| – Gross Shorts: | 2,906,328 | 4,169,880 | 704,503 |
| – Long to Short Ratio: | 0.2 to 1 | 1.6 to 1 | 0.6 to 1 |
| NET POSITION TREND: | |||
| – Strength Index Score (3 Year Range Pct): | 9.7 | 88.0 | 42.9 |
| – Strength Index Reading (3 Year Range): | Bearish-Extreme | Bullish-Extreme | Bearish |
| NET POSITION MOVEMENT INDEX: | |||
| – 6-Week Change in Strength Index: | 8.9 | -10.7 | 25.4 |
30-Day Federal Funds Futures:
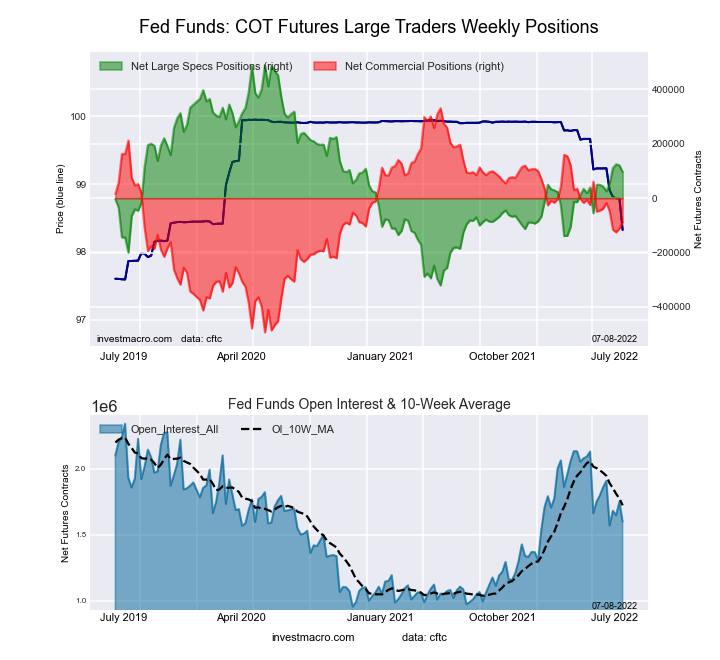 The 30-Day Federal Funds large speculator standing this week was a net position of 96,186 contracts in the data reported through Tuesday. This was a weekly fall of -24,396 contracts from the previous week which had a total of 120,582 net contracts.
This week’s current strength score (the trader positioning range over the past three years, measured from 0 to 100) shows the speculators are currently Bullish with a score of 51.5 percent. The commercials are Bearish with a score of 49.1 percent and the small traders (not shown in chart) are Bearish with a score of 40.3 percent.
| 30-Day Federal Funds Statistics | SPECULATORS | COMMERCIALS | SMALL TRADERS |
| – Percent of Open Interest Longs: | 12.6 | 72.4 | 2.6 |
| – Percent of Open Interest Shorts: | 6.6 | 77.9 | 3.0 |
| – Net Position: | 96,186 | -88,543 | -7,643 |
| – Gross Longs: | 201,100 | 1,157,169 | 40,944 |
| – Gross Shorts: | 104,914 | 1,245,712 | 48,587 |
| – Long to Short Ratio: | 1.9 to 1 | 0.9 to 1 | 0.8 to 1 |
| NET POSITION TREND: | |||
| – Strength Index Score (3 Year Range Pct): | 51.5 | 49.1 | 40.3 |
| – Strength Index Reading (3 Year Range): | Bullish | Bearish | Bearish |
| NET POSITION MOVEMENT INDEX: | |||
| – 6-Week Change in Strength Index: | 6.6 | -6.1 | -9.3 |
2-Year Treasury Note Futures:
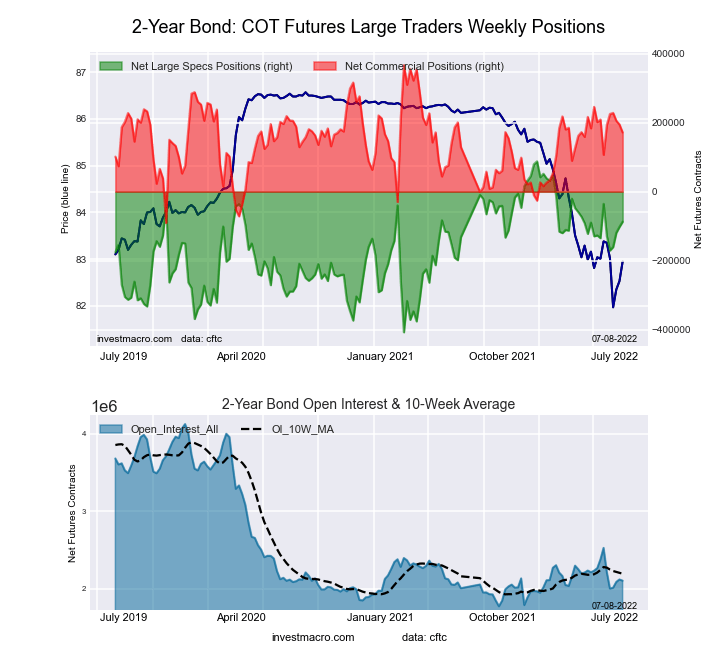 The 2-Year Treasury Note large speculator standing this week was a net position of -87,042 contracts in the data reported through Tuesday. This was a weekly rise of 15,076 contracts from the previous week which had a total of -102,118 net contracts.
This week’s current strength score (the trader positioning range over the past three years, measured from 0 to 100) shows the speculators are currently Bullish with a score of 64.7 percent. The commercials are Bullish with a score of 57.4 percent and the small traders (not shown in chart) are Bearish-Extreme with a score of 13.3 percent.
| 2-Year Treasury Note Statistics | SPECULATORS | COMMERCIALS | SMALL TRADERS |
| – Percent of Open Interest Longs: | 13.0 | 78.2 | 6.9 |
| – Percent of Open Interest Shorts: | 17.1 | 70.0 | 10.9 |
| – Net Position: | -87,042 | 171,591 | -84,549 |
| – Gross Longs: | 273,378 | 1,643,875 | 144,139 |
| – Gross Shorts: | 360,420 | 1,472,284 | 228,688 |
| – Long to Short Ratio: | 0.8 to 1 | 1.1 to 1 | 0.6 to 1 |
| NET POSITION TREND: | |||
| – Strength Index Score (3 Year Range Pct): | 64.7 | 57.4 | 13.3 |
| – Strength Index Reading (3 Year Range): | Bullish | Bullish | Bearish-Extreme |
| NET POSITION MOVEMENT INDEX: | |||
| – 6-Week Change in Strength Index: | -10.5 | 14.2 | -5.4 |
5-Year Treasury Note Futures:
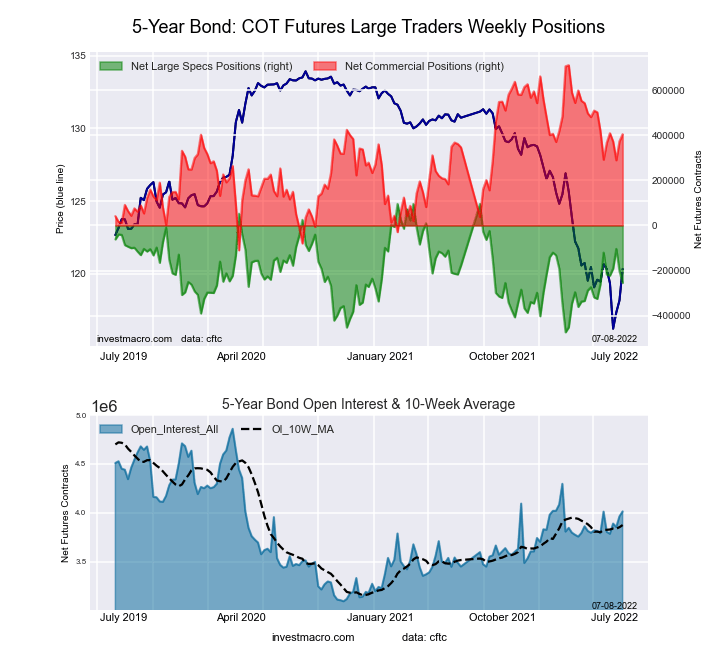 The 5-Year Treasury Note large speculator standing this week was a net position of -254,453 contracts in the data reported through Tuesday. This was a weekly reduction of -51,789 contracts from the previous week which had a total of -202,664 net contracts.
This week’s current strength score (the trader positioning range over the past three years, measured from 0 to 100) shows the speculators are currently Bearish with a score of 38.6 percent. The commercials are Bullish with a score of 62.7 percent and the small traders (not shown in chart) are Bearish with a score of 39.7 percent.
| 5-Year Treasury Note Statistics | SPECULATORS | COMMERCIALS | SMALL TRADERS |
| – Percent of Open Interest Longs: | 7.0 | 83.9 | 7.6 |
| – Percent of Open Interest Shorts: | 13.3 | 73.8 | 11.3 |
| – Net Position: | -254,453 | 404,953 | -150,500 |
| – Gross Longs: | 280,011 | 3,368,874 | 303,153 |
| – Gross Shorts: | 534,464 | 2,963,921 | 453,653 |
| – Long to Short Ratio: | 0.5 to 1 | 1.1 to 1 | 0.7 to 1 |
| NET POSITION TREND: | |||
| – Strength Index Score (3 Year Range Pct): | 38.6 | 62.7 | 39.7 |
| – Strength Index Reading (3 Year Range): | Bearish | Bullish | Bearish |
| NET POSITION MOVEMENT INDEX: | |||
| – 6-Week Change in Strength Index: | -23.5 | 13.7 | 5.8 |
10-Year Treasury Note Futures:
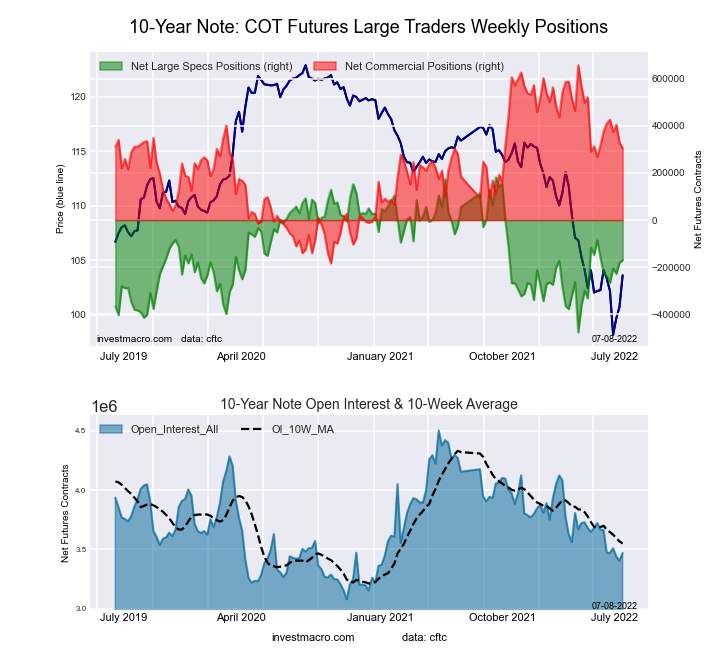 The 10-Year Treasury Note large speculator standing this week was a net position of -170,500 contracts in the data reported through Tuesday. This was a weekly increase of 11,180 contracts from the previous week which had a total of -181,680 net contracts.
This week’s current strength score (the trader positioning range over the past three years, measured from 0 to 100) shows the speculators are currently Bearish with a score of 46.5 percent. The commercials are Bullish with a score of 58.0 percent and the small traders (not shown in chart) are Bearish with a score of 48.0 percent.
| 10-Year Treasury Note Statistics | SPECULATORS | COMMERCIALS | SMALL TRADERS |
| – Percent of Open Interest Longs: | 8.6 | 79.8 | 9.0 |
| – Percent of Open Interest Shorts: | 13.5 | 71.0 | 12.8 |
| – Net Position: | -170,500 | 303,820 | -133,320 |
| – Gross Longs: | 297,724 | 2,767,198 | 310,990 |
| – Gross Shorts: | 468,224 | 2,463,378 | 444,310 |
| – Long to Short Ratio: | 0.6 to 1 | 1.1 to 1 | 0.7 to 1 |
| NET POSITION TREND: | |||
| – Strength Index Score (3 Year Range Pct): | 46.5 | 58.0 | 48.0 |
| – Strength Index Reading (3 Year Range): | Bearish | Bullish | Bearish |
| NET POSITION MOVEMENT INDEX: | |||
| – 6-Week Change in Strength Index: | 8.3 | -8.7 | 4.3 |
Ultra 10-Year Notes Futures:
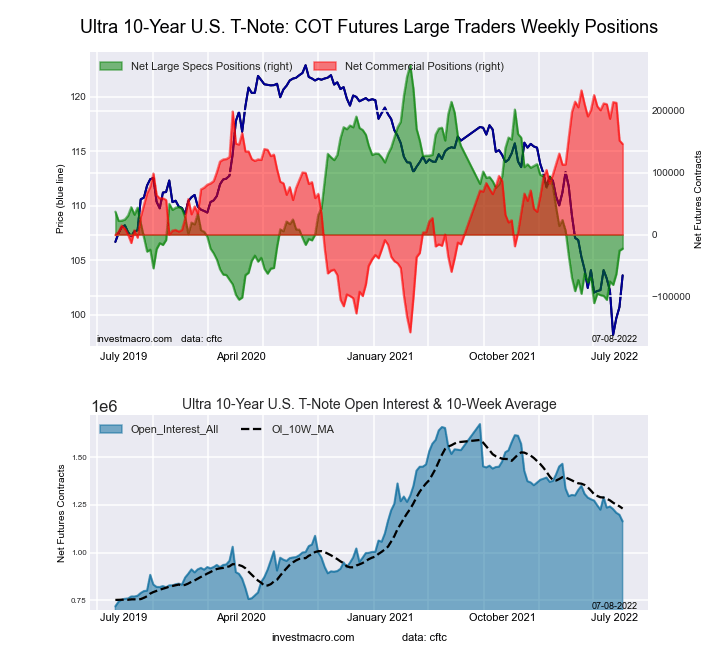 The Ultra 10-Year Notes large speculator standing this week was a net position of -22,742 contracts in the data reported through Tuesday. This was a weekly gain of 3,338 contracts from the previous week which had a total of -26,080 net contracts.
This week’s current strength score (the trader positioning range over the past three years, measured from 0 to 100) shows the speculators are currently Bearish with a score of 22.9 percent. The commercials are Bullish with a score of 77.8 percent and the small traders (not shown in chart) are Bearish with a score of 42.4 percent.
| Ultra 10-Year Notes Statistics | SPECULATORS | COMMERCIALS | SMALL TRADERS |
| – Percent of Open Interest Longs: | 5.2 | 82.5 | 11.7 |
| – Percent of Open Interest Shorts: | 7.2 | 69.9 | 22.4 |
| – Net Position: | -22,742 | 146,293 | -123,551 |
| – Gross Longs: | 60,503 | 959,975 | 136,617 |
| – Gross Shorts: | 83,245 | 813,682 | 260,168 |
| – Long to Short Ratio: | 0.7 to 1 | 1.2 to 1 | 0.5 to 1 |
| NET POSITION TREND: | |||
| – Strength Index Score (3 Year Range Pct): | 22.9 | 77.8 | 42.4 |
| – Strength Index Reading (3 Year Range): | Bearish | Bullish | Bearish |
| NET POSITION MOVEMENT INDEX: | |||
| – 6-Week Change in Strength Index: | 19.8 | -16.8 | -6.6 |
US Treasury Bonds Futures:
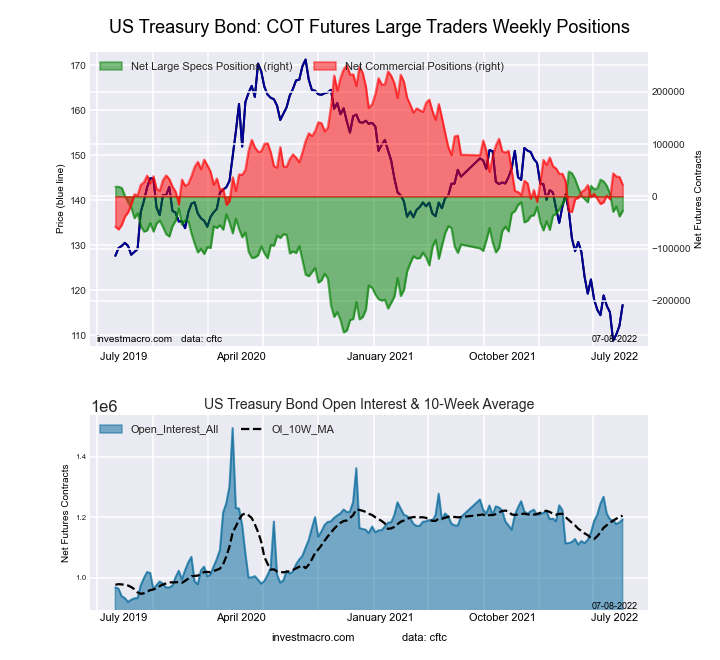 The US Treasury Bonds large speculator standing this week was a net position of -27,673 contracts in the data reported through Tuesday. This was a weekly advance of 10,580 contracts from the previous week which had a total of -38,253 net contracts.
This week’s current strength score (the trader positioning range over the past three years, measured from 0 to 100) shows the speculators are currently Bullish with a score of 75.6 percent. The commercials are Bearish-Extreme with a score of 18.5 percent and the small traders (not shown in chart) are Bullish with a score of 57.1 percent.
| US Treasury Bonds Statistics | SPECULATORS | COMMERCIALS | SMALL TRADERS |
| – Percent of Open Interest Longs: | 8.1 | 77.5 | 13.9 |
| – Percent of Open Interest Shorts: | 10.4 | 75.7 | 13.5 |
| – Net Position: | -27,673 | 22,028 | 5,645 |
| – Gross Longs: | 96,356 | 924,975 | 166,387 |
| – Gross Shorts: | 124,029 | 902,947 | 160,742 |
| – Long to Short Ratio: | 0.8 to 1 | 1.0 to 1 | 1.0 to 1 |
| NET POSITION TREND: | |||
| – Strength Index Score (3 Year Range Pct): | 75.6 | 18.5 | 57.1 |
| – Strength Index Reading (3 Year Range): | Bullish | Bearish-Extreme | Bullish |
| NET POSITION MOVEMENT INDEX: | |||
| – 6-Week Change in Strength Index: | -18.3 | 11.9 | 18.2 |
Ultra US Treasury Bonds Futures:
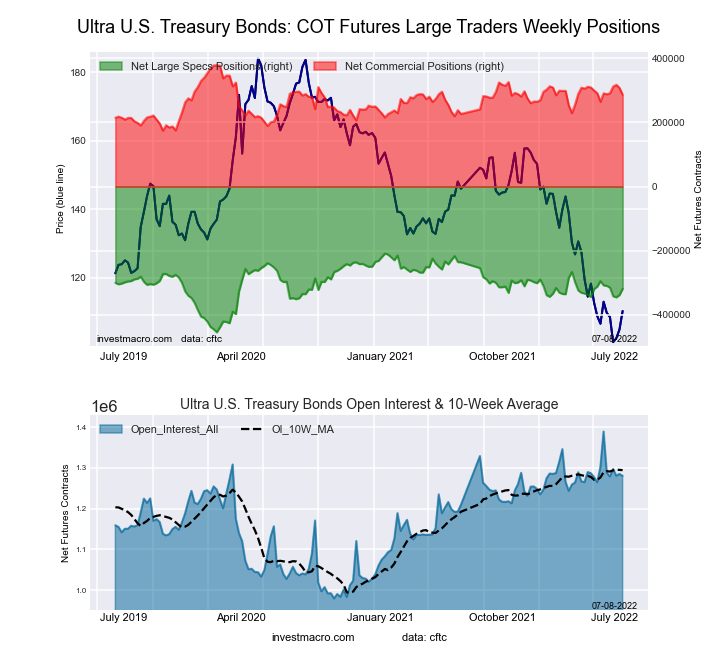 The Ultra US Treasury Bonds large speculator standing this week was a net position of -318,655 contracts in the data reported through Tuesday. This was a weekly increase of 19,328 contracts from the previous week which had a total of -337,983 net contracts.
This week’s current strength score (the trader positioning range over the past three years, measured from 0 to 100) shows the speculators are currently Bullish with a score of 55.2 percent. The commercials are Bullish with a score of 54.9 percent and the small traders (not shown in chart) are Bullish with a score of 51.8 percent.
| Ultra US Treasury Bonds Statistics | SPECULATORS | COMMERCIALS | SMALL TRADERS |
| – Percent of Open Interest Longs: | 4.2 | 84.1 | 11.5 |
| – Percent of Open Interest Shorts: | 29.1 | 61.8 | 8.9 |
| – Net Position: | -318,655 | 285,953 | 32,702 |
| – Gross Longs: | 53,639 | 1,077,401 | 147,290 |
| – Gross Shorts: | 372,294 | 791,448 | 114,588 |
| – Long to Short Ratio: | 0.1 to 1 | 1.4 to 1 | 1.3 to 1 |
| NET POSITION TREND: | |||
| – Strength Index Score (3 Year Range Pct): | 55.2 | 54.9 | 51.8 |
| – Strength Index Reading (3 Year Range): | Bullish | Bullish | Bullish |
| NET POSITION MOVEMENT INDEX: | |||
| – 6-Week Change in Strength Index: | -4.4 | -2.1 | 10.8 |
Article By InvestMacro – Receive our weekly COT Reports by Email
*COT Report: The COT data, released weekly to the public each Friday, is updated through the most recent Tuesday (data is 3 days old) and shows a quick view of how large speculators or non-commercials (for-profit traders) were positioned in the futures markets.
The CFTC categorizes trader positions according to commercial hedgers (traders who use futures contracts for hedging as part of the business), non-commercials (large traders who speculate to realize trading profits) and nonreportable traders (usually small traders/speculators) as well as their open interest (contracts open in the market at time of reporting).See CFTC criteria here.
More By This Author:
COT Week 25 Charts: Bond Market Speculator Bets Rose This Week Led By 5-Year & 2-Year Bonds
COT Week 25 Charts: Metals Speculator Bets Slightly Higher As Gold & Silver Bets Gain
Currency Speculators Boost Japanese Yen Bets To 15-Week High While Canadian Dollar Bets Drop Sharply


Comments
Log in or sign up to join the conversation.