
Here are the latest charts and statistics for the Commitment of Traders (COT) data published by the Commodities Futures Trading Commission (CFTC).
The latest COT data is updated through Tuesday June 21st and shows a quick view of how large traders (for-profit speculators and commercial entities) were positioned in the futures markets.
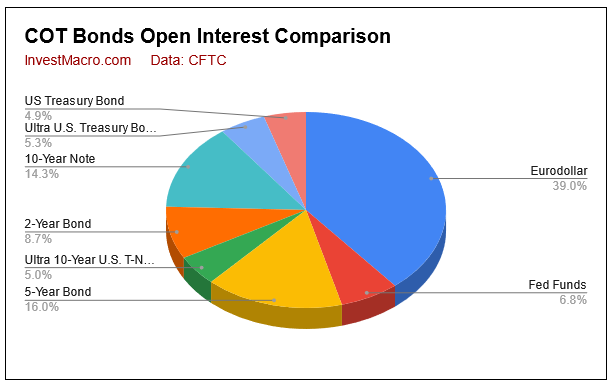
COT bond market speculator bets were overall higher this week as five out of the eight bond markets we cover had higher positioning this week while three markets had lower contracts.
Leading the gains for the bond markets was the 5-Year Bond (86,980 contracts) and the 2-Year Bond (41,139 contracts) with the Ultra 10-Year Bond (17,501 contracts), Fed Funds (13,490 contracts) and the Long US Bond (10,078 contracts) also showing higher speculator bets for the week. Meanwhile, leading the declines in speculator bets this week were the Eurodollar (-143,197 contracts) and the 10-Year Bond (-22,655 contracts) with the Ultra US Bond (-3,455 contracts) also seeing lower speculator bets on the week.
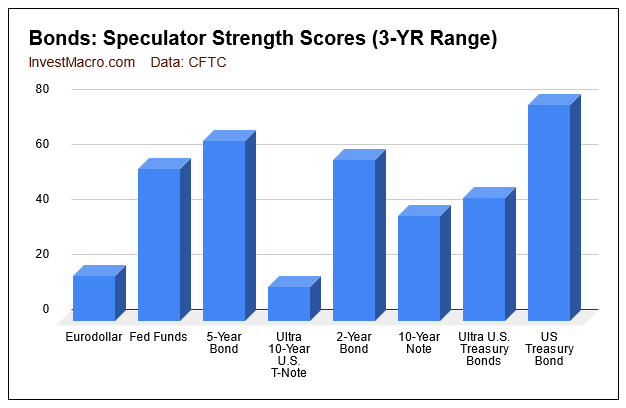
Strength scores (3-Year range of Speculator positions, from 0 to 100 where above 80 is extreme bullish and below 20 is extreme bearish) show that the US Treasury Bond (78.3 percent) is at the highest level of the bonds markets currently with the 5-Year Bond (65 percent), 2-Year Bond (58.2 percent), and Fed Funds (55 percent) following. The Ultra 10-Year Bonds (12.2 percent) and 3-Month Eurodollars (16.2 percent) continue to remain in bearish-extreme levels and have the weakest speculator strength scores at the moment.
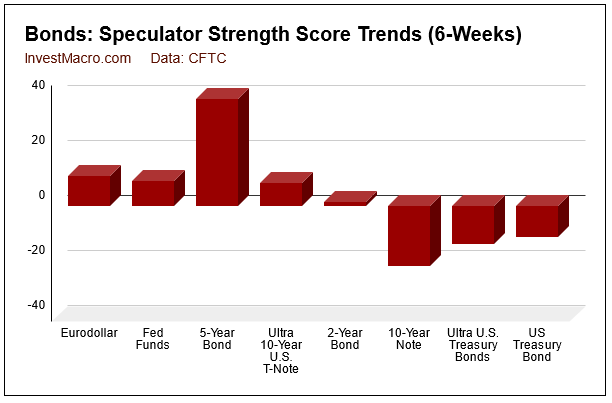
Strength score trends (or move index, that calculate 6-week changes in strength scores) shows that the 5-Year Bond (38.9 percent) continues to lead the strength trends. Next up is Eurodollars (11.1 percent) and then Fed Funds with a 9.3 percent strength change over the past six weeks. The 10-Year Bonds (-21.6 percent) leads the falling speculator trends over the past six weeks followed by the Ultra US Treasury Bonds (-13.7 percent) and then the US Treasury Bond (-11.3 percent).
Data Snapshot of Bond Market Traders | Columns Legend
| Eurodollar | 9,411,173 | 11 | -1,997,889 | 16 | 2,355,143 | 83 | -357,254 | 26 |
| 5-Year | 3,854,228 | 43 | -104,091 | 65 | 289,493 | 49 | -185,402 | 30 |
| 10-Year | 3,440,085 | 25 | -228,184 | 38 | 404,754 | 70 | -176,570 | 38 |
| 2-Year | 2,086,917 | 13 | -119,283 | 58 | 205,599 | 65 | -86,316 | 13 |
| FedFunds | 1,646,303 | 50 | 124,421 | 55 | -125,477 | 45 | 1,056 | 62 |
| Long T-Bond | 1,177,791 | 45 | -19,322 | 78 | 37,921 | 26 | -18,599 | 38 |
3-Month Eurodollars Futures:
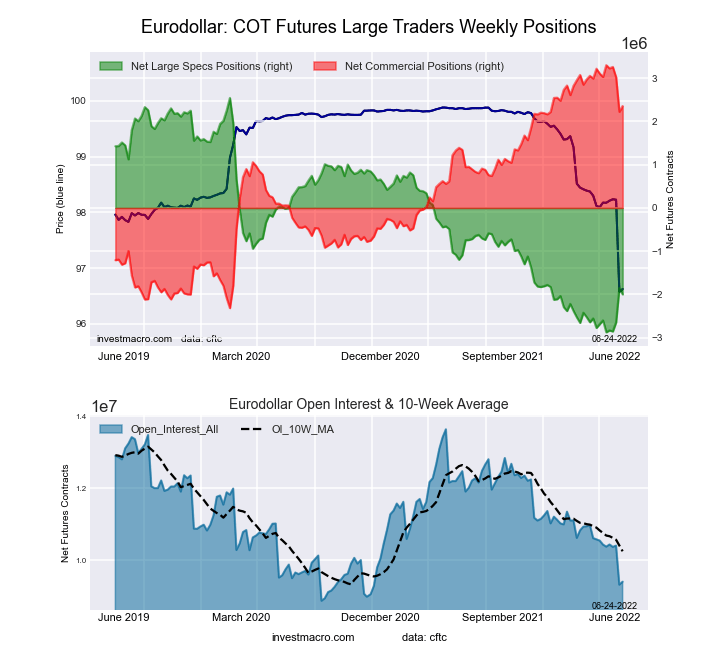
The 3-Month Eurodollars large speculator standing this week was a net position of -1,997,889 contracts in the data reported through Tuesday. This was a weekly reduction of -143,197 contracts from the previous week which had a total of -1,854,692 net contracts.
This week’s current strength score (the trader positioning range over the past three years, measured from 0 to 100) shows the speculators are currently Bearish-Extreme with a score of 16.2 percent. The commercials are Bullish-Extreme with a score of 83.2 percent and the small traders (not shown in chart) are Bearish with a score of 25.8 percent.
| 3-Month Eurodollars Statistics | SPECULATORS | COMMERCIALS | SMALL TRADERS |
| – Percent of Open Interest Longs: | 6.5 | 69.6 | 4.3 |
| – Percent of Open Interest Shorts: | 27.8 | 44.6 | 8.1 |
| – Net Position: | -1,997,889 | 2,355,143 | -357,254 |
| – Gross Longs: | 614,934 | 6,554,406 | 400,504 |
| – Gross Shorts: | 2,612,823 | 4,199,263 | 757,758 |
| – Long to Short Ratio: | 0.2 to 1 | 1.6 to 1 | 0.5 to 1 |
| NET POSITION TREND: | |||
| – Strength Index Score (3 Year Range Pct): | 16.2 | 83.2 | 25.8 |
| – Strength Index Reading (3 Year Range): | Bearish-Extreme | Bullish-Extreme | Bearish |
| NET POSITION MOVEMENT INDEX: | |||
| – 6-Week Change in Strength Index: | 11.1 | -12.0 | 16.0 |
30-Day Federal Funds Futures:
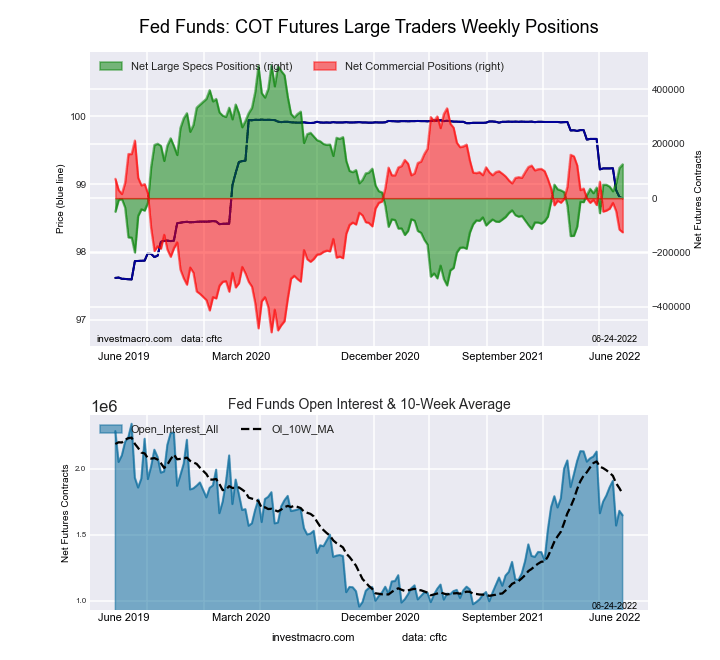
The 30-Day Federal Funds large speculator standing this week was a net position of 124,421 contracts in the data reported through Tuesday. This was a weekly advance of 13,490 contracts from the previous week which had a total of 110,931 net contracts.
This week’s current strength score (the trader positioning range over the past three years, measured from 0 to 100) shows the speculators are currently Bullish with a score of 55.0 percent. The commercials are Bearish with a score of 44.7 percent and the small traders (not shown in chart) are Bullish with a score of 62.4 percent.
| 30-Day Federal Funds Statistics | SPECULATORS | COMMERCIALS | SMALL TRADERS |
| – Percent of Open Interest Longs: | 14.1 | 70.0 | 2.6 |
| – Percent of Open Interest Shorts: | 6.5 | 77.6 | 2.6 |
| – Net Position: | 124,421 | -125,477 | 1,056 |
| – Gross Longs: | 231,344 | 1,151,997 | 43,549 |
| – Gross Shorts: | 106,923 | 1,277,474 | 42,493 |
| – Long to Short Ratio: | 2.2 to 1 | 0.9 to 1 | 1.0 to 1 |
| NET POSITION TREND: | |||
| – Strength Index Score (3 Year Range Pct): | 55.0 | 44.7 | 62.4 |
| – Strength Index Reading (3 Year Range): | Bullish | Bearish | Bullish |
| NET POSITION MOVEMENT INDEX: | |||
| – 6-Week Change in Strength Index: | 9.3 | -9.3 | 2.4 |
2-Year Treasury Note Futures:
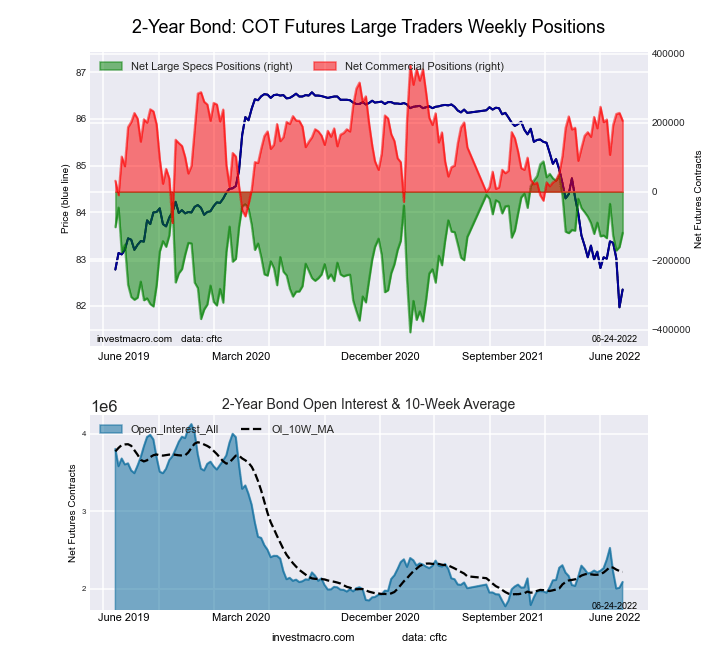
The 2-Year Treasury Note large speculator standing this week was a net position of -119,283 contracts in the data reported through Tuesday. This was a weekly gain of 41,139 contracts from the previous week which had a total of -160,422 net contracts.
This week’s current strength score (the trader positioning range over the past three years, measured from 0 to 100) shows the speculators are currently Bullish with a score of 58.2 percent. The commercials are Bullish with a score of 64.8 percent and the small traders (not shown in chart) are Bearish-Extreme with a score of 12.6 percent.
| 2-Year Treasury Note Statistics | SPECULATORS | COMMERCIALS | SMALL TRADERS |
| – Percent of Open Interest Longs: | 12.3 | 76.8 | 6.4 |
| – Percent of Open Interest Shorts: | 18.0 | 67.0 | 10.6 |
| – Net Position: | -119,283 | 205,599 | -86,316 |
| – Gross Longs: | 257,375 | 1,603,236 | 134,031 |
| – Gross Shorts: | 376,658 | 1,397,637 | 220,347 |
| – Long to Short Ratio: | 0.7 to 1 | 1.1 to 1 | 0.6 to 1 |
| NET POSITION TREND: | |||
| – Strength Index Score (3 Year Range Pct): | 58.2 | 64.8 | 12.6 |
| – Strength Index Reading (3 Year Range): | Bullish | Bullish | Bearish-Extreme |
| NET POSITION MOVEMENT INDEX: | |||
| – 6-Week Change in Strength Index: | 1.5 | 0.9 | -4.8 |
5-Year Treasury Note Futures:
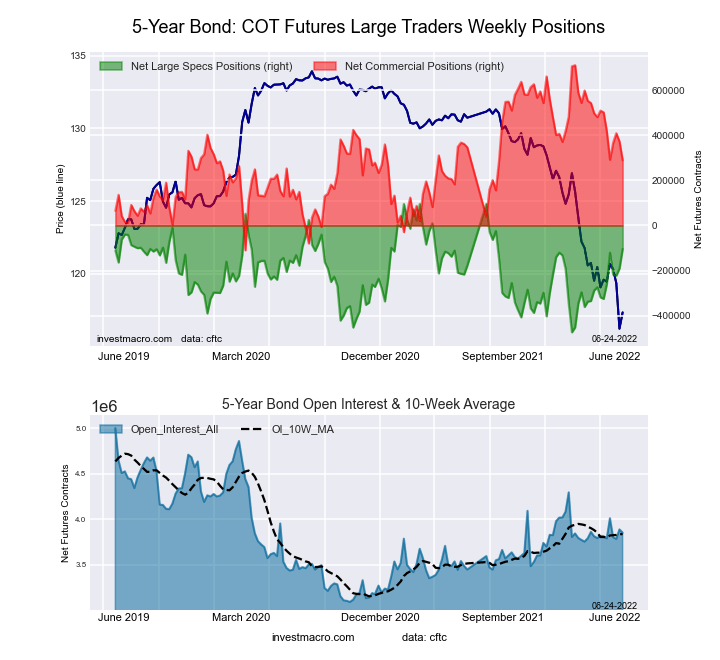
The 5-Year Treasury Note large speculator standing this week was a net position of -104,091 contracts in the data reported through Tuesday. This was a weekly lift of 86,980 contracts from the previous week which had a total of -191,071 net contracts.
This week’s current strength score (the trader positioning range over the past three years, measured from 0 to 100) shows the speculators are currently Bullish with a score of 65.0 percent. The commercials are Bearish with a score of 48.6 percent and the small traders (not shown in chart) are Bearish with a score of 30.1 percent.
| 5-Year Treasury Note Statistics | SPECULATORS | COMMERCIALS | SMALL TRADERS |
| – Percent of Open Interest Longs: | 9.7 | 80.9 | 7.6 |
| – Percent of Open Interest Shorts: | 12.4 | 73.4 | 12.4 |
| – Net Position: | -104,091 | 289,493 | -185,402 |
| – Gross Longs: | 373,807 | 3,119,594 | 292,913 |
| – Gross Shorts: | 477,898 | 2,830,101 | 478,315 |
| – Long to Short Ratio: | 0.8 to 1 | 1.1 to 1 | 0.6 to 1 |
| NET POSITION TREND: | |||
| – Strength Index Score (3 Year Range Pct): | 65.0 | 48.6 | 30.1 |
| – Strength Index Reading (3 Year Range): | Bullish | Bearish | Bearish |
| NET POSITION MOVEMENT INDEX: | |||
| – 6-Week Change in Strength Index: | 38.9 | -25.9 | -2.4 |
10-Year Treasury Note Futures:
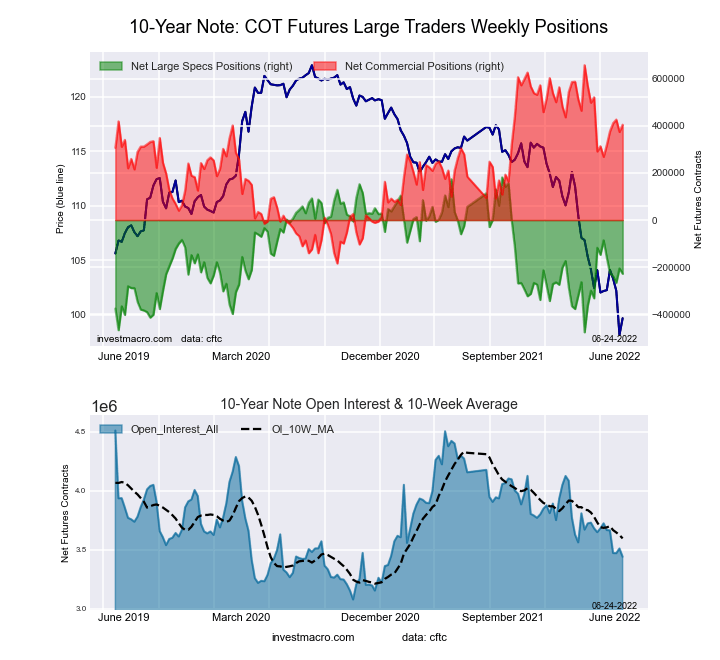
The 10-Year Treasury Note large speculator standing this week was a net position of -228,184 contracts in the data reported through Tuesday. This was a weekly fall of -22,655 contracts from the previous week which had a total of -205,529 net contracts.
This week’s current strength score (the trader positioning range over the past three years, measured from 0 to 100) shows the speculators are currently Bearish with a score of 37.8 percent. The commercials are Bullish with a score of 70.0 percent and the small traders (not shown in chart) are Bearish with a score of 37.9 percent.
| 10-Year Treasury Note Statistics | SPECULATORS | COMMERCIALS | SMALL TRADERS |
| – Percent of Open Interest Longs: | 7.8 | 80.3 | 8.4 |
| – Percent of Open Interest Shorts: | 14.5 | 68.5 | 13.5 |
| – Net Position: | -228,184 | 404,754 | -176,570 |
| – Gross Longs: | 269,685 | 2,760,756 | 287,654 |
| – Gross Shorts: | 497,869 | 2,356,002 | 464,224 |
| – Long to Short Ratio: | 0.5 to 1 | 1.2 to 1 | 0.6 to 1 |
| NET POSITION TREND: | |||
| – Strength Index Score (3 Year Range Pct): | 37.8 | 70.0 | 37.9 |
| – Strength Index Reading (3 Year Range): | Bearish | Bullish | Bearish |
| NET POSITION MOVEMENT INDEX: | |||
| – 6-Week Change in Strength Index: | -21.6 | 16.2 | 1.4 |
Ultra 10-Year Notes Futures:
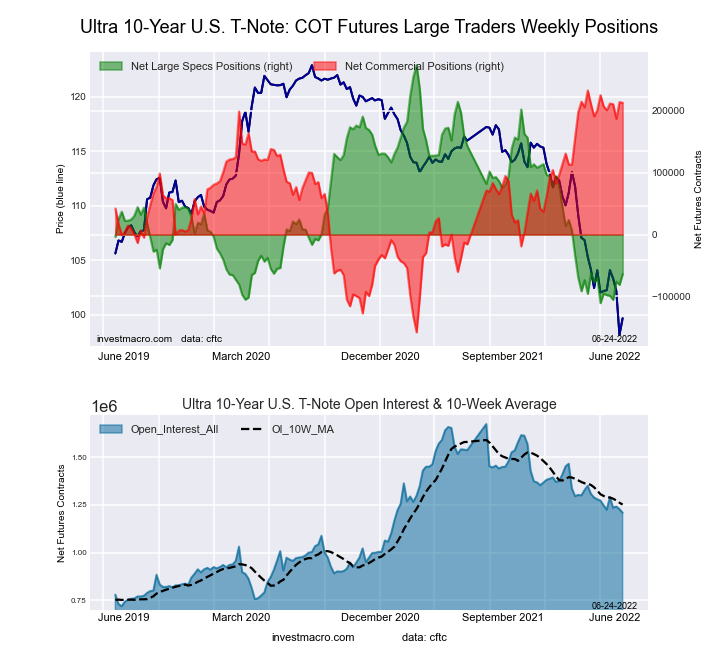
The Ultra 10-Year Notes large speculator standing this week was a net position of -63,706 contracts in the data reported through Tuesday. This was a weekly boost of 17,501 contracts from the previous week which had a total of -81,207 net contracts.
This week’s current strength score (the trader positioning range over the past three years, measured from 0 to 100) shows the speculators are currently Bearish-Extreme with a score of 12.2 percent. The commercials are Bullish-Extreme with a score of 94.9 percent and the small traders (not shown in chart) are Bearish with a score of 26.5 percent.
| Ultra 10-Year Notes Statistics | SPECULATORS | COMMERCIALS | SMALL TRADERS |
| – Percent of Open Interest Longs: | 4.6 | 85.6 | 8.9 |
| – Percent of Open Interest Shorts: | 9.8 | 68.0 | 21.2 |
| – Net Position: | -63,706 | 212,999 | -149,293 |
| – Gross Longs: | 55,061 | 1,035,003 | 107,499 |
| – Gross Shorts: | 118,767 | 822,004 | 256,792 |
| – Long to Short Ratio: | 0.5 to 1 | 1.3 to 1 | 0.4 to 1 |
| NET POSITION TREND: | |||
| – Strength Index Score (3 Year Range Pct): | 12.2 | 94.9 | 26.5 |
| – Strength Index Reading (3 Year Range): | Bearish-Extreme | Bullish-Extreme | Bearish |
| NET POSITION MOVEMENT INDEX: | |||
| – 6-Week Change in Strength Index: | 8.3 | 1.5 | -23.2 |
US Treasury Bonds Futures:
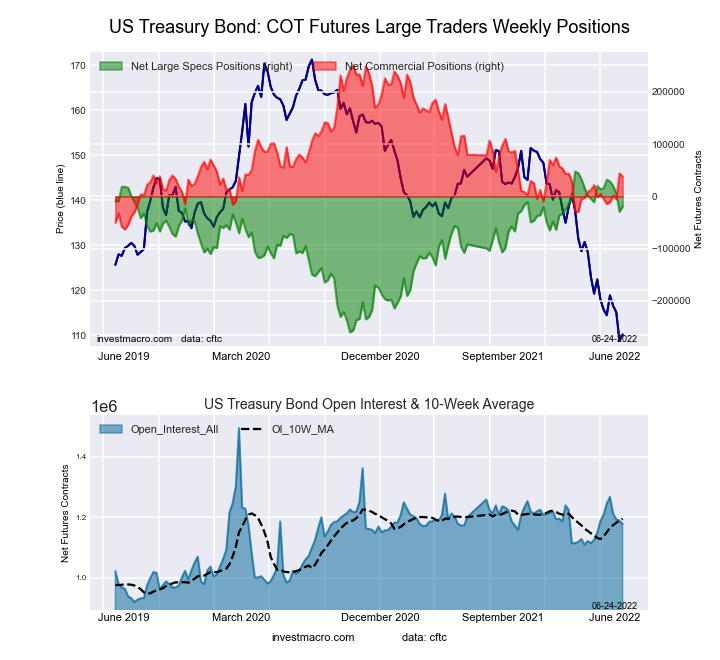
The US Treasury Bonds large speculator standing this week was a net position of -19,322 contracts in the data reported through Tuesday. This was a weekly rise of 10,078 contracts from the previous week which had a total of -29,400 net contracts.
This week’s current strength score (the trader positioning range over the past three years, measured from 0 to 100) shows the speculators are currently Bullish with a score of 78.3 percent. The commercials are Bearish with a score of 26.5 percent and the small traders (not shown in chart) are Bearish with a score of 37.8 percent.
| US Treasury Bonds Statistics | SPECULATORS | COMMERCIALS | SMALL TRADERS |
| – Percent of Open Interest Longs: | 8.4 | 77.1 | 13.2 |
| – Percent of Open Interest Shorts: | 10.1 | 73.9 | 14.7 |
| – Net Position: | -19,322 | 37,921 | -18,599 |
| – Gross Longs: | 99,282 | 907,963 | 154,938 |
| – Gross Shorts: | 118,604 | 870,042 | 173,537 |
| – Long to Short Ratio: | 0.8 to 1 | 1.0 to 1 | 0.9 to 1 |
| NET POSITION TREND: | |||
| – Strength Index Score (3 Year Range Pct): | 78.3 | 26.5 | 37.8 |
| – Strength Index Reading (3 Year Range): | Bullish | Bearish | Bearish |
| NET POSITION MOVEMENT INDEX: | |||
| – 6-Week Change in Strength Index: | -11.3 | 14.8 | -6.5 |
Ultra US Treasury Bonds Futures:
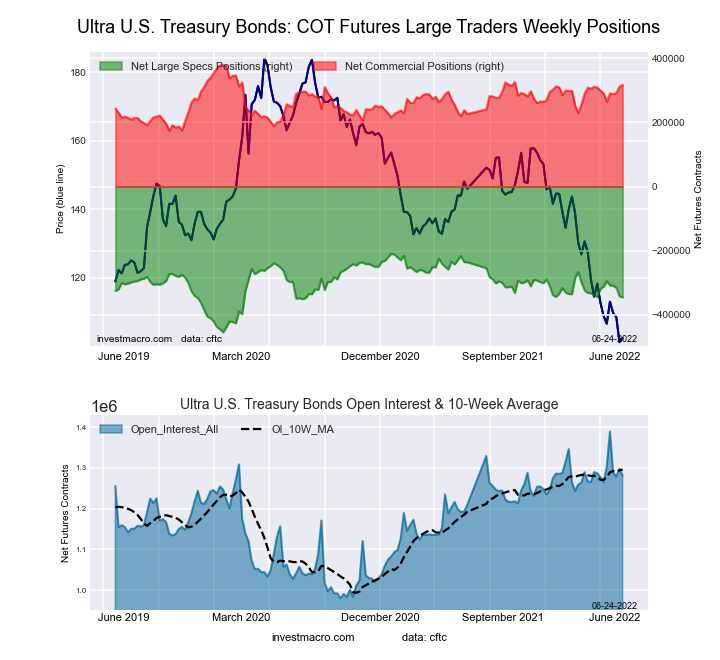
The Ultra US Treasury Bonds large speculator standing this week was a net position of -345,056 contracts in the data reported through Tuesday. This was a weekly reduction of -3,455 contracts from the previous week which had a total of -341,601 net contracts.
This week’s current strength score (the trader positioning range over the past three years, measured from 0 to 100) shows the speculators are currently Bearish with a score of 44.4 percent. The commercials are Bullish with a score of 70.0 percent and the small traders (not shown in chart) are Bearish with a score of 48.5 percent.
| Ultra US Treasury Bonds Statistics | SPECULATORS | COMMERCIALS | SMALL TRADERS |
| – Percent of Open Interest Longs: | 3.3 | 85.1 | 11.4 |
| – Percent of Open Interest Shorts: | 30.3 | 60.3 | 9.2 |
| – Net Position: | -345,056 | 316,836 | 28,220 |
| – Gross Longs: | 42,428 | 1,089,411 | 145,784 |
| – Gross Shorts: | 387,484 | 772,575 | 117,564 |
| – Long to Short Ratio: | 0.1 to 1 | 1.4 to 1 | 1.2 to 1 |
| NET POSITION TREND: | |||
| – Strength Index Score (3 Year Range Pct): | 44.4 | 70.0 | 48.5 |
| – Strength Index Reading (3 Year Range): | Bearish | Bullish | Bearish |
| NET POSITION MOVEMENT INDEX: | |||
| – 6-Week Change in Strength Index: | -13.7 | 12.8 | 5.3 |
*COT Report: The COT data, released weekly to the public each Friday, is updated through the most recent Tuesday (data is 3 days old) and shows a quick view of how large speculators or non-commercials (for-profit traders) were positioned in the futures markets.
The CFTC categorizes trader positions according to commercial hedgers (traders who use futures contracts for hedging as part of the business), non-commercials (large traders who speculate to realize trading profits) and nonreportable traders (usually small traders/speculators) as well as their open interest (contracts open in the market at time of reporting).See CFTC criteria here.


Comments
Log in or sign up to join the conversation.