

Here are the latest charts and statistics for the Commitment of Traders (COT) data published by the Commodities Futures Trading Commission (CFTC).
The latest COT data is updated through Tuesday July 5th and shows a quick view of how large traders (for-profit speculators and commercial entities) were positioned in the futures markets.
The soft commodities market speculator bets headed lower this week as just three out of the eleven soft commodities markets we cover had higher positioning this week while the other eight markets had lower speculator contracts.
Leading the gains for soft commodities markets was Soybean Meal (2,019 contracts) and Coffee (1,587 contracts) with Wheat (705 contracts) also having a positive week. Meanwhile, leading the declines in speculator bets this week were Corn (-67,397 contracts) and Sugar (-39,197 contracts) with Cocoa (-13,454 contracts), Soybeans (-11,702 contracts), Soybean Oil (-10,237 contracts), Live Cattle (-7,806 contracts), Cotton (-5,845 contracts) and Lean Hogs (-1,080 contracts) also registering lower bets on the week.

Strength scores (measuring the 3-Year range of Speculator positions, from 0 to 100 where above 80 percent is extreme bullish and below 20 percent is extreme bearish) show that Coffee (79.3 percent) and Soybean Meal (80.9 percent) are leading this week with Soybean Meal just above the bullish extreme level (80 percent). On the lower side, Live Cattle (4.5 percent) and Cocoa (10.7 percent) are the lowest strength scores and are both in bearish extreme levels this week.

Strength score trends (or move index, that calculate 6-week changes in strength scores) shows once again this week how much the softs sentiment has cooled off after a scorching start to the year. Lean Hogs (8.6 percent), Coffee (8.4 percent) and Soybean Meal (7.8 percent) are the only markets that have had a gain of strength scores over the past six weeks. On the downside, Soybean Oil (-29.9 percent), Sugar (-25.9 percent) and Wheat (-23.4 percent) are leading the downtrends among the soft commodities markets.
Data Snapshot of Commodity Market Traders | Columns Legend
| WTI Crude | 1,637,862 | 0 | 280,523 | 0 | -304,217 | 100 | 23,694 | 48 |
| Corn | 1,331,035 | 0 | 260,705 | 63 | -207,441 | 42 | -53,264 | 12 |
| Natural Gas | 977,507 | 0 | -130,519 | 39 | 91,950 | 60 | 38,569 | 71 |
| Sugar | 713,245 | 0 | 83,512 | 54 | -85,255 | 52 | 1,743 | 10 |
| Soybeans | 638,675 | 7 | 125,491 | 52 | -93,638 | 56 | -31,853 | 17 |
| Gold | 498,210 | 13 | 145,660 | 0 | -165,585 | 100 | 19,925 | 0 |
| Wheat | 288,754 | 0 | 8,384 | 30 | 623 | 61 | -9,007 | 64 |
| Heating Oil | 264,269 | 21 | 6,486 | 52 | -22,775 | 47 | 16,289 | 55 |
| Coffee | 193,731 | 1 | 46,787 | 79 | -49,139 | 25 | 2,352 | 14 |
| Copper | 183,331 | 15 | -31,796 | 19 | 31,340 | 81 | 456 | 28 |
| Brent | 166,711 | 13 | -38,514 | 47 | 37,309 | 55 | 1,205 | 26 |
| Silver | 140,463 | 7 | 5,139 | 0 | -11,622 | 100 | 6,483 | 0 |
| Platinum | 72,895 | 44 | -2,734 | 0 | -1,670 | 100 | 4,404 | 23 |
| Palladium | 7,373 | 5 | -3,410 | 4 | 4,104 | 98 | -694 | 4 |
CORN Futures:
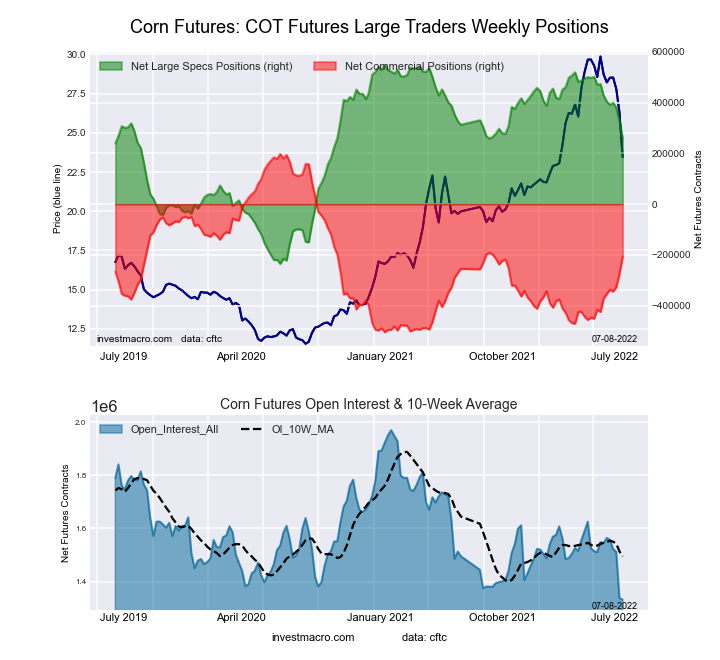
The CORN large speculator standing this week totaled a net position of 260,705 contracts in the data reported through Tuesday. This was a weekly reduction of -67,397 contracts from the previous week which had a total of 328,102 net contracts.
This week’s current strength score (the trader positioning range over the past three years, measured from 0 to 100) shows the speculators are currently Bullish with a score of 63.3 percent. The commercials are Bearish with a score of 42.4 percent and the small traders (not shown in chart) are Bearish-Extreme with a score of 12.4 percent.
| CORN Futures Statistics | SPECULATORS | COMMERCIALS | SMALL TRADERS |
| – Percent of Open Interest Longs: | 29.7 | 46.5 | 9.2 |
| – Percent of Open Interest Shorts: | 10.1 | 62.1 | 13.2 |
| – Net Position: | 260,705 | -207,441 | -53,264 |
| – Gross Longs: | 395,713 | 618,691 | 122,652 |
| – Gross Shorts: | 135,008 | 826,132 | 175,916 |
| – Long to Short Ratio: | 2.9 to 1 | 0.7 to 1 | 0.7 to 1 |
| NET POSITION TREND: | |||
| – Strength Index Score (3 Year Range Pct): | 63.3 | 42.4 | 12.4 |
| – Strength Index Reading (3 Year Range): | Bullish | Bearish | Bearish-Extreme |
| NET POSITION MOVEMENT INDEX: | |||
| – 6-Week Change in Strength Index: | -21.4 | 23.5 | 1.2 |
SUGAR Futures:
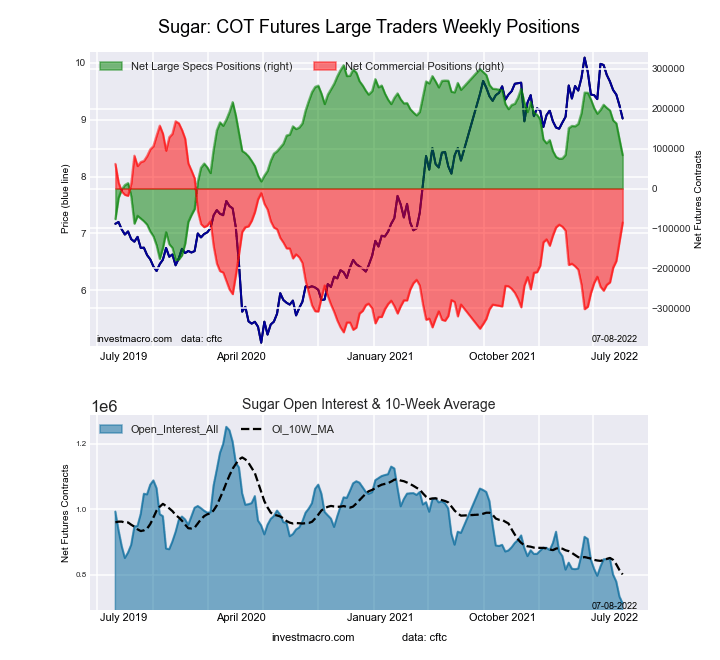
The SUGAR large speculator standing this week totaled a net position of 83,512 contracts in the data reported through Tuesday. This was a weekly decrease of -39,197 contracts from the previous week which had a total of 122,709 net contracts.
This week’s current strength score (the trader positioning range over the past three years, measured from 0 to 100) shows the speculators are currently Bullish with a score of 53.8 percent. The commercials are Bullish with a score of 52.0 percent and the small traders (not shown in chart) are Bearish-Extreme with a score of 10.0 percent.
| SUGAR Futures Statistics | SPECULATORS | COMMERCIALS | SMALL TRADERS |
| – Percent of Open Interest Longs: | 26.8 | 50.7 | 9.1 |
| – Percent of Open Interest Shorts: | 15.1 | 62.7 | 8.9 |
| – Net Position: | 83,512 | -85,255 | 1,743 |
| – Gross Longs: | 191,390 | 361,892 | 65,138 |
| – Gross Shorts: | 107,878 | 447,147 | 63,395 |
| – Long to Short Ratio: | 1.8 to 1 | 0.8 to 1 | 1.0 to 1 |
| NET POSITION TREND: | |||
| – Strength Index Score (3 Year Range Pct): | 53.8 | 52.0 | 10.0 |
| – Strength Index Reading (3 Year Range): | Bullish | Bullish | Bearish-Extreme |
| NET POSITION MOVEMENT INDEX: | |||
| – 6-Week Change in Strength Index: | -25.9 | 32.3 | -54.7 |
COFFEE Futures:
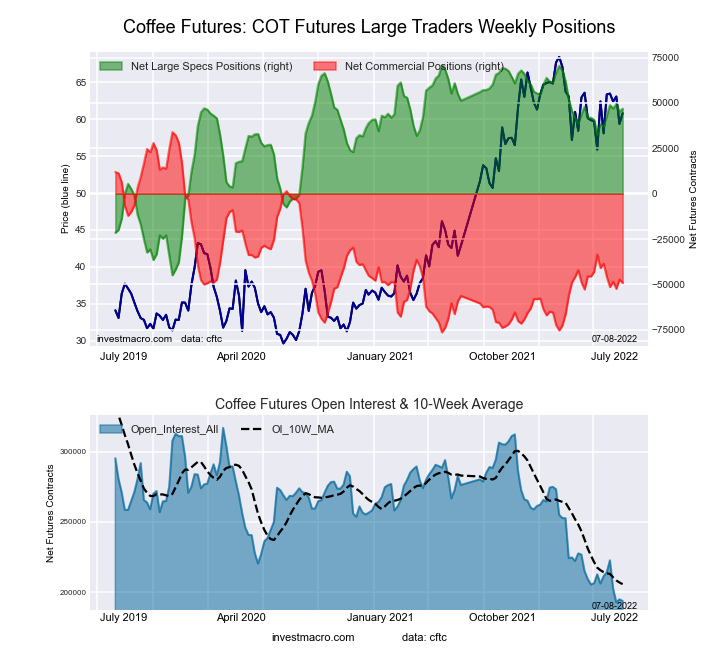
The COFFEE large speculator standing this week totaled a net position of 46,787 contracts in the data reported through Tuesday. This was a weekly gain of 1,587 contracts from the previous week which had a total of 45,200 net contracts.
This week’s current strength score (the trader positioning range over the past three years, measured from 0 to 100) shows the speculators are currently Bullish with a score of 79.3 percent. The commercials are Bearish with a score of 24.7 percent and the small traders (not shown in chart) are Bearish-Extreme with a score of 13.5 percent.
| COFFEE Futures Statistics | SPECULATORS | COMMERCIALS | SMALL TRADERS |
| – Percent of Open Interest Longs: | 28.4 | 49.2 | 4.5 |
| – Percent of Open Interest Shorts: | 4.2 | 74.6 | 3.3 |
| – Net Position: | 46,787 | -49,139 | 2,352 |
| – Gross Longs: | 54,965 | 95,332 | 8,800 |
| – Gross Shorts: | 8,178 | 144,471 | 6,448 |
| – Long to Short Ratio: | 6.7 to 1 | 0.7 to 1 | 1.4 to 1 |
| NET POSITION TREND: | |||
| – Strength Index Score (3 Year Range Pct): | 79.3 | 24.7 | 13.5 |
| – Strength Index Reading (3 Year Range): | Bullish | Bearish | Bearish-Extreme |
| NET POSITION MOVEMENT INDEX: | |||
| – 6-Week Change in Strength Index: | 8.4 | -9.7 | 9.4 |
SOYBEANS Futures:
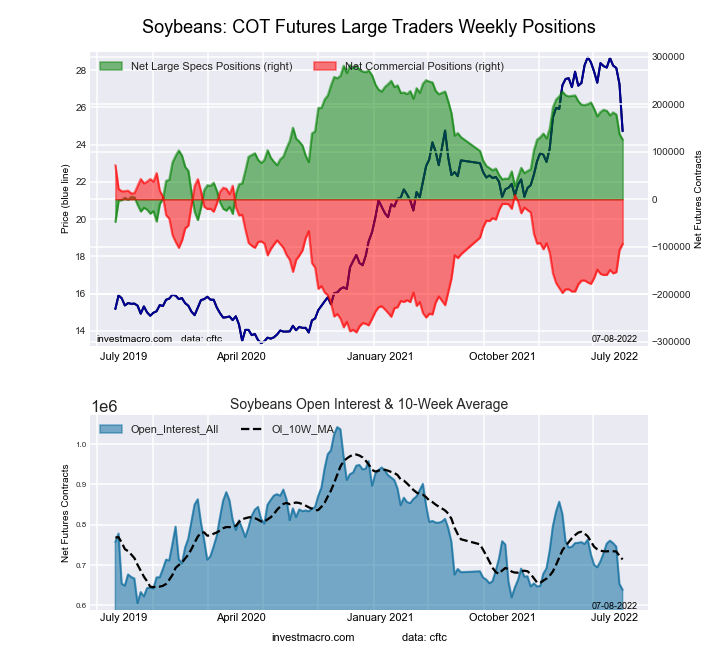
The SOYBEANS large speculator standing this week totaled a net position of 125,491 contracts in the data reported through Tuesday. This was a weekly reduction of -11,702 contracts from the previous week which had a total of 137,193 net contracts.
This week’s current strength score (the trader positioning range over the past three years, measured from 0 to 100) shows the speculators are currently Bullish with a score of 52.4 percent. The commercials are Bullish with a score of 55.6 percent and the small traders (not shown in chart) are Bearish-Extreme with a score of 17.2 percent.
| SOYBEANS Futures Statistics | SPECULATORS | COMMERCIALS | SMALL TRADERS |
| – Percent of Open Interest Longs: | 29.8 | 51.8 | 5.9 |
| – Percent of Open Interest Shorts: | 10.2 | 66.4 | 10.9 |
| – Net Position: | 125,491 | -93,638 | -31,853 |
| – Gross Longs: | 190,571 | 330,584 | 37,700 |
| – Gross Shorts: | 65,080 | 424,222 | 69,553 |
| – Long to Short Ratio: | 2.9 to 1 | 0.8 to 1 | 0.5 to 1 |
| NET POSITION TREND: | |||
| – Strength Index Score (3 Year Range Pct): | 52.4 | 55.6 | 17.2 |
| – Strength Index Reading (3 Year Range): | Bullish | Bullish | Bearish-Extreme |
| NET POSITION MOVEMENT INDEX: | |||
| – 6-Week Change in Strength Index: | -19.1 | 19.5 | -4.3 |
SOYBEAN OIL Futures:
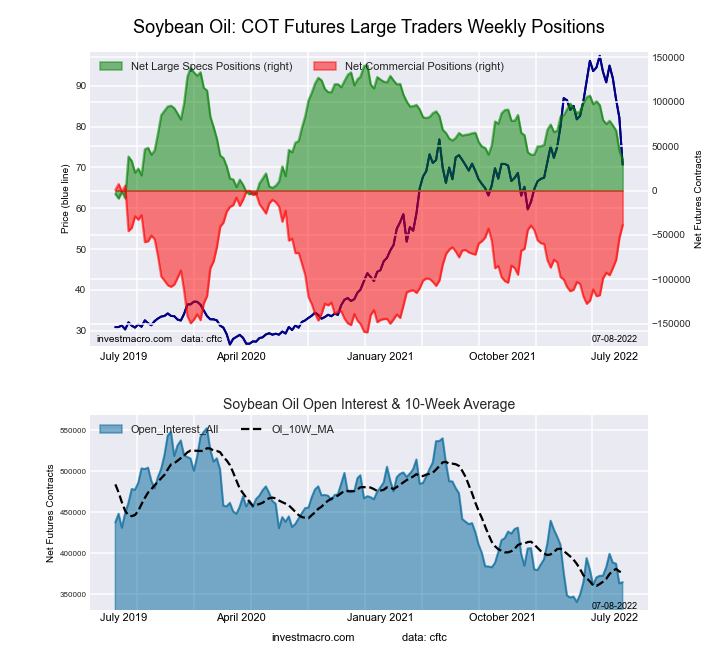
The SOYBEAN OIL large speculator standing this week totaled a net position of 34,681 contracts in the data reported through Tuesday. This was a weekly fall of -10,237 contracts from the previous week which had a total of 44,918 net contracts.
This week’s current strength score (the trader positioning range over the past three years, measured from 0 to 100) shows the speculators are currently Bearish with a score of 29.0 percent. The commercials are Bullish with a score of 72.5 percent and the small traders (not shown in chart) are Bearish with a score of 28.1 percent.
| SOYBEAN OIL Futures Statistics | SPECULATORS | COMMERCIALS | SMALL TRADERS |
| – Percent of Open Interest Longs: | 20.8 | 57.1 | 7.3 |
| – Percent of Open Interest Shorts: | 11.3 | 67.7 | 6.2 |
| – Net Position: | 34,681 | -38,614 | 3,933 |
| – Gross Longs: | 75,794 | 208,440 | 26,452 |
| – Gross Shorts: | 41,113 | 247,054 | 22,519 |
| – Long to Short Ratio: | 1.8 to 1 | 0.8 to 1 | 1.2 to 1 |
| NET POSITION TREND: | |||
| – Strength Index Score (3 Year Range Pct): | 29.0 | 72.5 | 28.1 |
| – Strength Index Reading (3 Year Range): | Bearish | Bullish | Bearish |
| NET POSITION MOVEMENT INDEX: | |||
| – 6-Week Change in Strength Index: | -29.9 | 36.0 | -56.9 |
SOYBEAN MEAL Futures:
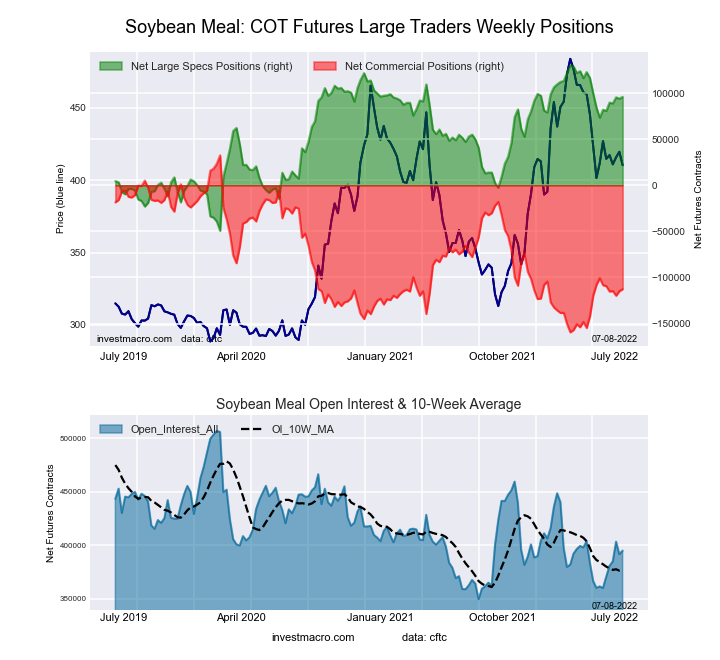
The SOYBEAN MEAL large speculator standing this week totaled a net position of 95,944 contracts in the data reported through Tuesday. This was a weekly gain of 2,019 contracts from the previous week which had a total of 93,925 net contracts.
This week’s current strength score (the trader positioning range over the past three years, measured from 0 to 100) shows the speculators are currently Bullish-Extreme with a score of 80.9 percent. The commercials are Bearish with a score of 24.3 percent and the small traders (not shown in chart) are Bearish with a score of 21.3 percent.
| SOYBEAN MEAL Futures Statistics | SPECULATORS | COMMERCIALS | SMALL TRADERS |
| – Percent of Open Interest Longs: | 28.3 | 42.5 | 10.6 |
| – Percent of Open Interest Shorts: | 4.0 | 71.0 | 6.3 |
| – Net Position: | 95,944 | -112,761 | 16,817 |
| – Gross Longs: | 111,776 | 167,821 | 41,885 |
| – Gross Shorts: | 15,832 | 280,582 | 25,068 |
| – Long to Short Ratio: | 7.1 to 1 | 0.6 to 1 | 1.7 to 1 |
| NET POSITION TREND: | |||
| – Strength Index Score (3 Year Range Pct): | 80.9 | 24.3 | 21.3 |
| – Strength Index Reading (3 Year Range): | Bullish-Extreme | Bearish | Bearish |
| NET POSITION MOVEMENT INDEX: | |||
| – 6-Week Change in Strength Index: | 7.8 | -2.3 | -49.2 |
LIVE CATTLE Futures:
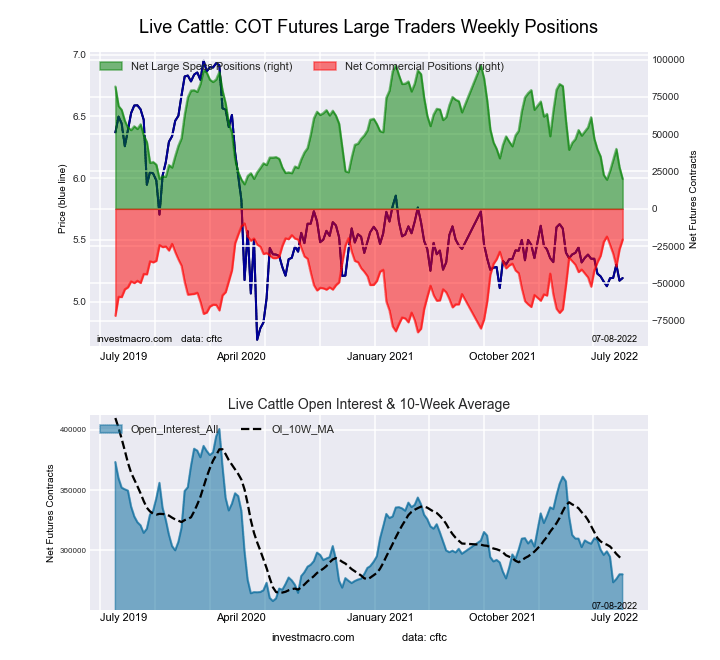
The LIVE CATTLE large speculator standing this week totaled a net position of 20,029 contracts in the data reported through Tuesday. This was a weekly decrease of -7,806 contracts from the previous week which had a total of 27,835 net contracts.
This week’s current strength score (the trader positioning range over the past three years, measured from 0 to 100) shows the speculators are currently Bearish-Extreme with a score of 4.5 percent. The commercials are Bullish-Extreme with a score of 85.1 percent and the small traders (not shown in chart) are Bullish-Extreme with a score of 83.7 percent.
| LIVE CATTLE Futures Statistics | SPECULATORS | COMMERCIALS | SMALL TRADERS |
| – Percent of Open Interest Longs: | 33.8 | 39.7 | 11.0 |
| – Percent of Open Interest Shorts: | 26.7 | 47.1 | 10.8 |
| – Net Position: | 20,029 | -20,591 | 562 |
| – Gross Longs: | 94,773 | 111,320 | 30,936 |
| – Gross Shorts: | 74,744 | 131,911 | 30,374 |
| – Long to Short Ratio: | 1.3 to 1 | 0.8 to 1 | 1.0 to 1 |
| NET POSITION TREND: | |||
| – Strength Index Score (3 Year Range Pct): | 4.5 | 85.1 | 83.7 |
| – Strength Index Reading (3 Year Range): | Bearish-Extreme | Bullish-Extreme | Bullish-Extreme |
| NET POSITION MOVEMENT INDEX: | |||
| – 6-Week Change in Strength Index: | -3.4 | 2.1 | 4.0 |
LEAN HOGS Futures:
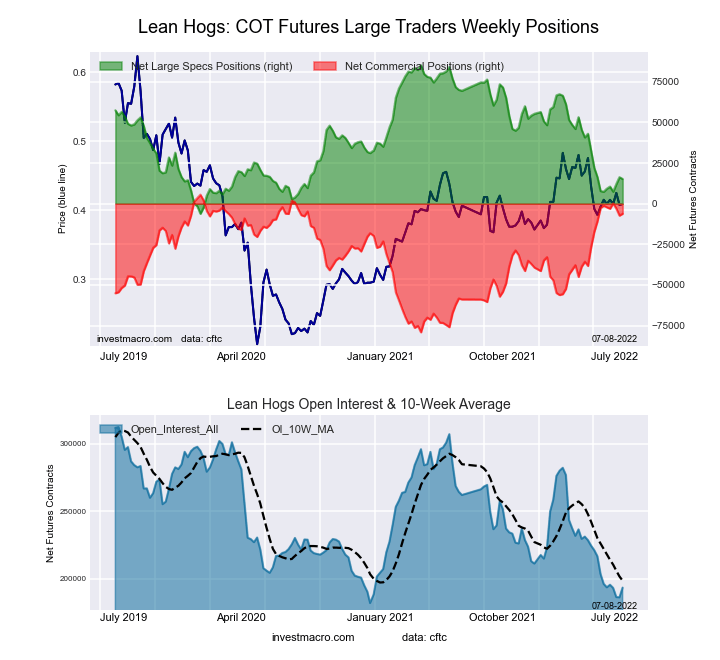
The LEAN HOGS large speculator standing this week totaled a net position of 15,207 contracts in the data reported through Tuesday. This was a weekly reduction of -1,080 contracts from the previous week which had a total of 16,287 net contracts.
This week’s current strength score (the trader positioning range over the past three years, measured from 0 to 100) shows the speculators are currently Bearish with a score of 23.3 percent. The commercials are Bullish-Extreme with a score of 86.1 percent and the small traders (not shown in chart) are Bearish with a score of 49.8 percent.
| LEAN HOGS Futures Statistics | SPECULATORS | COMMERCIALS | SMALL TRADERS |
| – Percent of Open Interest Longs: | 32.1 | 41.0 | 9.0 |
| – Percent of Open Interest Shorts: | 24.3 | 44.2 | 13.7 |
| – Net Position: | 15,207 | -6,194 | -9,013 |
| – Gross Longs: | 62,222 | 79,268 | 17,491 |
| – Gross Shorts: | 47,015 | 85,462 | 26,504 |
| – Long to Short Ratio: | 1.3 to 1 | 0.9 to 1 | 0.7 to 1 |
| NET POSITION TREND: | |||
| – Strength Index Score (3 Year Range Pct): | 23.3 | 86.1 | 49.8 |
| – Strength Index Reading (3 Year Range): | Bearish | Bullish-Extreme | Bearish |
| NET POSITION MOVEMENT INDEX: | |||
| – 6-Week Change in Strength Index: | 8.6 | -5.9 | -15.0 |
COTTON Futures:
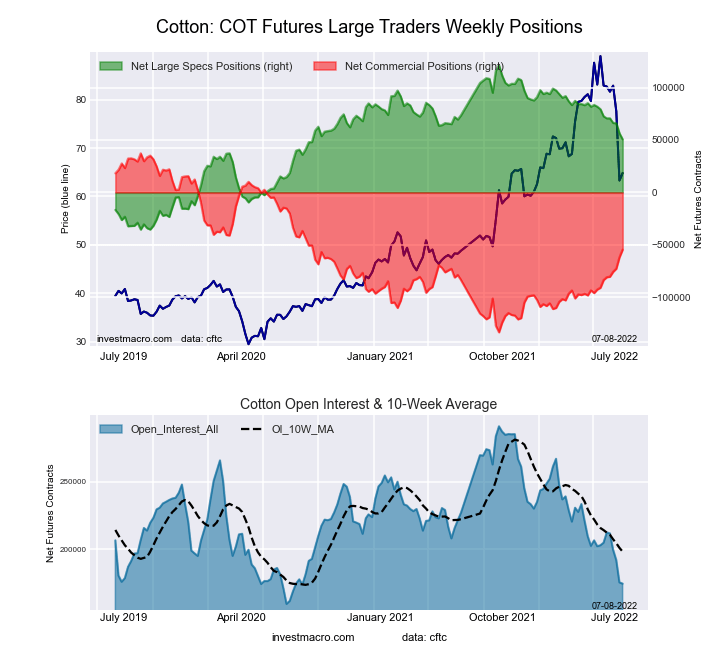
The COTTON large speculator standing this week totaled a net position of 50,545 contracts in the data reported through Tuesday. This was a weekly lowering of -5,845 contracts from the previous week which had a total of 56,390 net contracts.
This week’s current strength score (the trader positioning range over the past three years, measured from 0 to 100) shows the speculators are currently Bullish with a score of 54.8 percent. The commercials are Bearish with a score of 46.1 percent and the small traders (not shown in chart) are Bearish with a score of 37.6 percent.
| COTTON Futures Statistics | SPECULATORS | COMMERCIALS | SMALL TRADERS |
| – Percent of Open Interest Longs: | 40.7 | 41.6 | 7.1 |
| – Percent of Open Interest Shorts: | 11.7 | 72.9 | 4.8 |
| – Net Position: | 50,545 | -54,576 | 4,031 |
| – Gross Longs: | 70,871 | 72,524 | 12,397 |
| – Gross Shorts: | 20,326 | 127,100 | 8,366 |
| – Long to Short Ratio: | 3.5 to 1 | 0.6 to 1 | 1.5 to 1 |
| NET POSITION TREND: | |||
| – Strength Index Score (3 Year Range Pct): | 54.8 | 46.1 | 37.6 |
| – Strength Index Reading (3 Year Range): | Bullish | Bearish | Bearish |
| NET POSITION MOVEMENT INDEX: | |||
| – 6-Week Change in Strength Index: | -14.0 | 17.0 | -44.4 |
COCOA Futures:
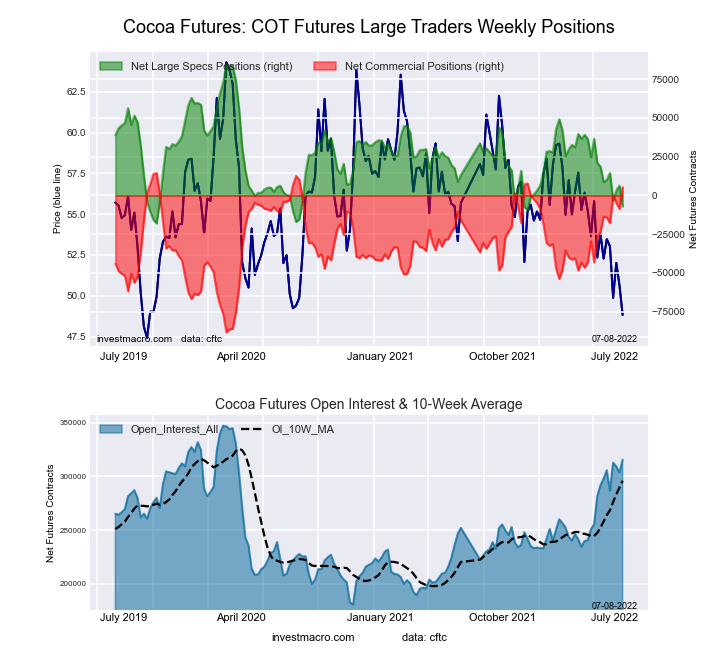
The COCOA large speculator standing this week totaled a net position of -7,115 contracts in the data reported through Tuesday. This was a weekly decline of -13,454 contracts from the previous week which had a total of 6,339 net contracts.
This week’s current strength score (the trader positioning range over the past three years, measured from 0 to 100) shows the speculators are currently Bearish-Extreme with a score of 10.7 percent. The commercials are Bullish-Extreme with a score of 91.0 percent and the small traders (not shown in chart) are Bearish-Extreme with a score of 14.8 percent.
| COCOA Futures Statistics | SPECULATORS | COMMERCIALS | SMALL TRADERS |
| – Percent of Open Interest Longs: | 29.9 | 46.4 | 4.6 |
| – Percent of Open Interest Shorts: | 32.1 | 44.7 | 4.0 |
| – Net Position: | -7,115 | 5,287 | 1,828 |
| – Gross Longs: | 94,360 | 146,524 | 14,461 |
| – Gross Shorts: | 101,475 | 141,237 | 12,633 |
| – Long to Short Ratio: | 0.9 to 1 | 1.0 to 1 | 1.1 to 1 |
| NET POSITION TREND: | |||
| – Strength Index Score (3 Year Range Pct): | 10.7 | 91.0 | 14.8 |
| – Strength Index Reading (3 Year Range): | Bearish-Extreme | Bullish-Extreme | Bearish-Extreme |
| NET POSITION MOVEMENT INDEX: | |||
| – 6-Week Change in Strength Index: | -15.4 | 18.3 | -31.4 |
WHEAT Futures:
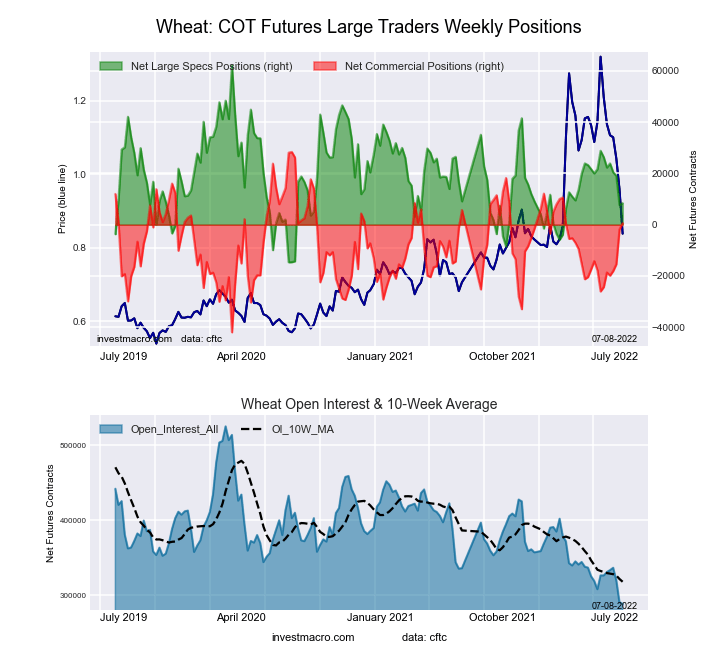
The WHEAT large speculator standing this week totaled a net position of 8,384 contracts in the data reported through Tuesday. This was a weekly rise of 705 contracts from the previous week which had a total of 7,679 net contracts.
This week’s current strength score (the trader positioning range over the past three years, measured from 0 to 100) shows the speculators are currently Bearish with a score of 30.0 percent. The commercials are Bullish with a score of 60.6 percent and the small traders (not shown in chart) are Bullish with a score of 63.7 percent.
| WHEAT Futures Statistics | SPECULATORS | COMMERCIALS | SMALL TRADERS |
| – Percent of Open Interest Longs: | 30.2 | 41.9 | 9.2 |
| – Percent of Open Interest Shorts: | 27.3 | 41.7 | 12.4 |
| – Net Position: | 8,384 | 623 | -9,007 |
| – Gross Longs: | 87,094 | 121,006 | 26,674 |
| – Gross Shorts: | 78,710 | 120,383 | 35,681 |
| – Long to Short Ratio: | 1.1 to 1 | 1.0 to 1 | 0.7 to 1 |
| NET POSITION TREND: | |||
| – Strength Index Score (3 Year Range Pct): | 30.0 | 60.6 | 63.7 |
| – Strength Index Reading (3 Year Range): | Bearish | Bullish | Bullish |
| NET POSITION MOVEMENT INDEX: | |||
| – 6-Week Change in Strength Index: | -23.4 | 35.5 | -36.3 |
*COT Report: The COT data, released weekly to the public each Friday, is updated through the most recent Tuesday (data is 3 days old) and shows a quick view of how large speculators or non-commercials (for-profit traders) were positioned in the futures markets.
The CFTC categorizes trader positions according to commercial hedgers (traders who use futures contracts for hedging as part of the business), non-commercials (large traders who speculate to realize trading profits) and nonreportable traders (usually small traders/speculators) as well as their open interest (contracts open in the market at time of reporting).See CFTC criteria here.
More By This Author:
COT Week 25 Charts: Bond Market Speculator Bets Rose This Week Led By 5-Year & 2-Year Bonds
COT Week 25 Charts: Metals Speculator Bets Slightly Higher As Gold & Silver Bets Gain
Currency Speculators Boost Japanese Yen Bets To 15-Week High While Canadian Dollar Bets Drop Sharply


Comments
Log in or sign up to join the conversation.