
Here are the latest charts and statistics for the Commitment of Traders (COT) data published by the Commodities Futures Trading Commission (CFTC).
The latest COT data for Week 33 is updated through Tuesday August 16th and shows a quick view of how large traders (for-profit speculators and commercial entities) were positioned in the futures markets.
Weekly Speculator Changes: COT Week 33 – Dow Jones Stock gains
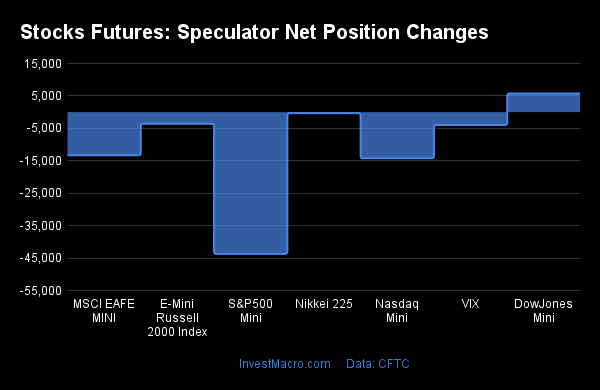
COT stock market speculator bets were overall lower this week as just one out of the seven stock markets we cover had higher positioning this week while the other six markets had lower contracts.
Recording the only positive gains for stock markets this week was the Dow Jones Industrial Average Mini with a total gain of 5,745 contracts.
The stock markets leading the declines in speculator bets this week were the S&P500 Mini (-43,723 contracts) with the Nasdaq Mini (-14,229 contracts), the MSCI EAFE Mini (-13,310 contracts), the VIX (-3,974 contracts), the Russell 2000 Mini (-3,598 contracts) and the Nikkei 225 USD (-303 contracts) also seeing lower bets on the week.
The Dow Jones Stock Index Mini, one of the most widely-watched stock market indices and made up of 30 large publicly-traded companies, rose this week for a third straight week. Speculator bets for the Dow have also now gained in seven out of the past eight weeks for a total gain of +18,508 contracts in that period. Overall, the speculator bets have been in bearish territory since January 4th but the recent improvement has brought the current spec position (-6,965 contracts) to the least bearish level since February 15th, a span of 27 weeks. The Dow Jones Stock Mini futures hit a four-month high this week above 34,000 but ended the week with a small loss.
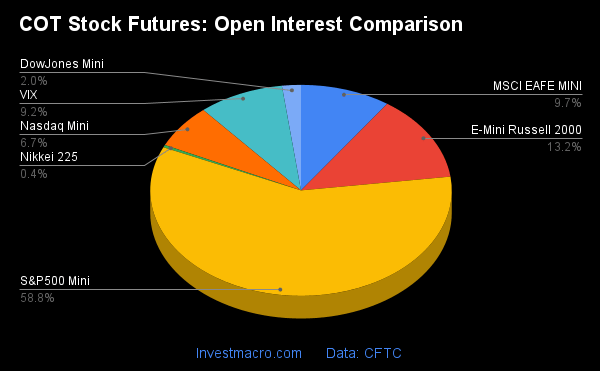
Data Snapshot of Stock Market Traders | Columns Legend
| S&P500-Mini | 2,346,224 | 10 | -287,984 | 3 | 354,217 | 100 | -66,233 | 12 |
| VIX | 366,823 | 46 | -102,169 | 58 | 105,269 | 40 | -3,100 | 76 |
| Nasdaq-Mini | 267,796 | 53 | 6,846 | 79 | 15,522 | 36 | -22,368 | 2 |
| DowJones-Mini | 81,037 | 43 | -6,965 | 29 | 9,366 | 72 | -2,401 | 26 |
| Nikkei 225 Yen | 58,199 | 41 | 5,968 | 52 | 19,496 | 78 | -25,464 | 22 |
| Nikkei 225 | 14,751 | 11 | -4,563 | 56 | 3,271 | 46 | 1,292 | 45 |
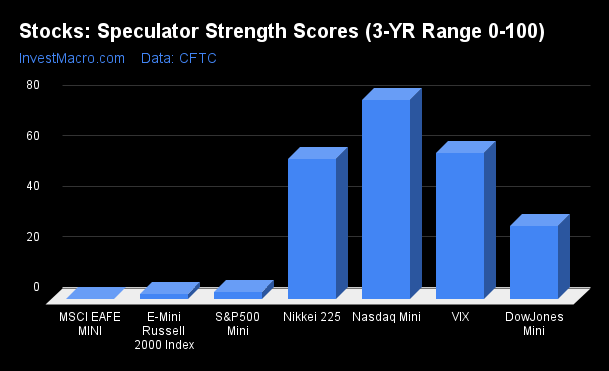
Strength Scores
Strength Scores (a normalized measure of Speculator positions over a 3-Year range, from 0 to 100 where above 80 is extreme bullish and below 20 is extreme bearish) showed that the Nasdaq-Mini (78.9 percent) leads the stocks currently and is in a bullish extreme position (above 80 percent). On the downside, the EAFE-Mini (0.0 percent), the Russell2000-Mini (2.0 percent) and the S&P500-Mini (2.8 percent) come in at the lowest strength level currently and are all in bearish extreme levels for speculators (below 20 percent).
Strength Statistics:
VIX (58.1 percent) vs VIX previous week (60.1 percent)
S&P500-Mini (2.8 percent) vs S&P500-Mini previous week (10.9 percent)
DowJones-Mini (29.0 percent) vs DowJones-Mini previous week (21.4 percent)
Nasdaq-Mini (78.9 percent) vs Nasdaq-Mini previous week (86.8 percent)
Russell2000-Mini (2.0 percent) vs Russell2000-Mini previous week (4.0 percent)
Nikkei USD (55.8 percent) vs Nikkei USD previous week (57.2 percent)
EAFE-Mini (0.0 percent) vs EAFE-Mini previous week (14.6 percent)
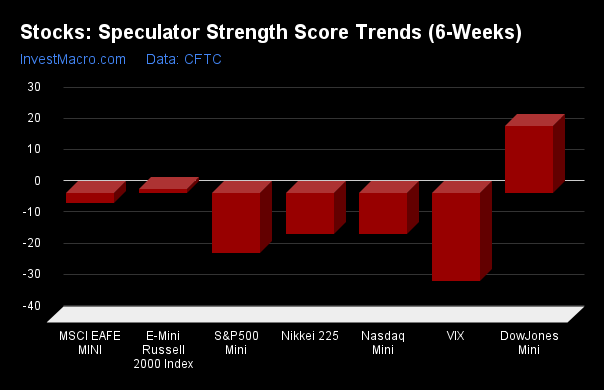
Strength Trends
Strength Score Trends (or move index, calculates the 6-week changes in strength scores) showed that the DowJones-Mini (21.5 percent) leads the past six weeks trends for stocks currently. The Dow Jones trend has gained from a 16.5 percent trend score last week. The Russell2000-Mini (1.2 percent) is the only other positive mover in the latest trends data and is up from a -4.6 percent score last week. The VIX (-28.3 percent) leads the downside trend scores currently while the next market with lower trend scores were the S&P500-Mini (-19.3 percent) followed by the Nasdaq-Mini (-13.4 percent) and the Nikkei USD (-13.4 percent).
Strength Trend Statistics:
VIX (-28.3 percent) vs VIX previous week (-24.3 percent)
S&P500-Mini (-19.3 percent) vs S&P500-Mini previous week (-19.5 percent)
DowJones-Mini (21.5 percent) vs DowJones-Mini previous week (16.5 percent)
Nasdaq-Mini (-13.4 percent) vs Nasdaq-Mini previous week (-1.7 percent)
Russell2000-Mini (1.2 percent) vs Russell2000-Mini previous week (-4.6 percent)
Nikkei USD (-13.4 percent) vs Nikkei USD previous week (-12.6 percent)
EAFE-Mini (-3.3 percent) vs EAFE-Mini previous week (-22.9 percent)
Individual Markets:
VIX Volatility Futures:
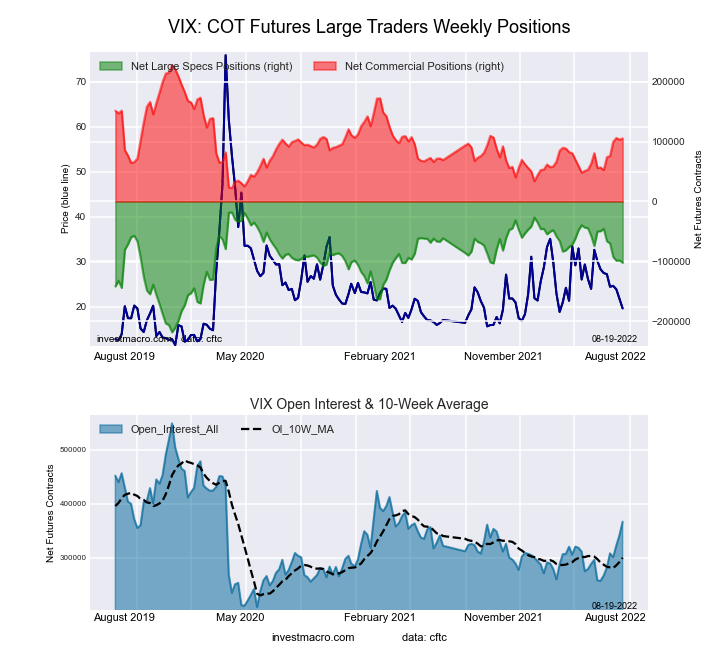
The VIX Volatility large speculator standing this week equaled a net position of -102,169 contracts in the data reported through Tuesday. This was a weekly fall of -3,974 contracts from the previous week which had a total of -98,195 net contracts.
This week’s current strength score (the trader positioning range over the past three years, measured from 0 to 100) shows the speculators are currently Bullish with a score of 58.1 percent. The commercials are Bearish with a score of 40.4 percent and the small traders (not shown in chart) are Bullish with a score of 76.2 percent.
| VIX Volatility Futures Statistics | SPECULATORS | COMMERCIALS | SMALL TRADERS |
| – Percent of Open Interest Longs: | 13.2 | 59.5 | 6.6 |
| – Percent of Open Interest Shorts: | 41.1 | 30.8 | 7.5 |
| – Net Position: | -102,169 | 105,269 | -3,100 |
| – Gross Longs: | 48,445 | 218,263 | 24,376 |
| – Gross Shorts: | 150,614 | 112,994 | 27,476 |
| – Long to Short Ratio: | 0.3 to 1 | 1.9 to 1 | 0.9 to 1 |
| NET POSITION TREND: | |||
| – Strength Index Score (3 Year Range Pct): | 58.1 | 40.4 | 76.2 |
| – Strength Index Reading (3 Year Range): | Bullish | Bearish | Bullish |
| NET POSITION MOVEMENT INDEX: | |||
| – 6-Week Change in Strength Index: | -28.3 | 25.8 | 18.4 |
S&P500 Mini Futures:
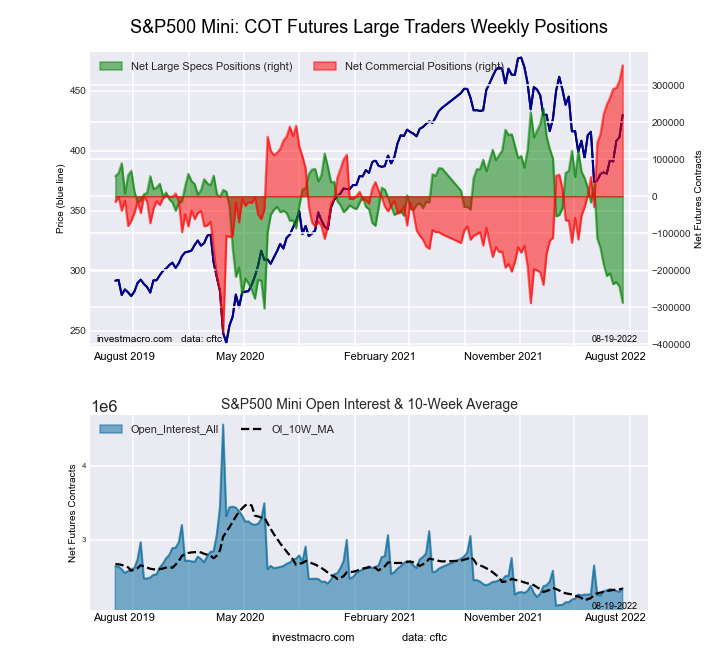
The S&P500 Mini large speculator standing this week equaled a net position of -287,984 contracts in the data reported through Tuesday. This was a weekly fall of -43,723 contracts from the previous week which had a total of -244,261 net contracts.
This week’s current strength score (the trader positioning range over the past three years, measured from 0 to 100) shows the speculators are currently Bearish-Extreme with a score of 2.8 percent. The commercials are Bullish-Extreme with a score of 100.0 percent and the small traders (not shown in chart) are Bearish-Extreme with a score of 12.5 percent.
| S&P500 Mini Futures Statistics | SPECULATORS | COMMERCIALS | SMALL TRADERS |
| – Percent of Open Interest Longs: | 9.7 | 77.8 | 9.7 |
| – Percent of Open Interest Shorts: | 22.0 | 62.7 | 12.5 |
| – Net Position: | -287,984 | 354,217 | -66,233 |
| – Gross Longs: | 227,370 | 1,826,100 | 227,544 |
| – Gross Shorts: | 515,354 | 1,471,883 | 293,777 |
| – Long to Short Ratio: | 0.4 to 1 | 1.2 to 1 | 0.8 to 1 |
| NET POSITION TREND: | |||
| – Strength Index Score (3 Year Range Pct): | 2.8 | 100.0 | 12.5 |
| – Strength Index Reading (3 Year Range): | Bearish-Extreme | Bullish-Extreme | Bearish-Extreme |
| NET POSITION MOVEMENT INDEX: | |||
| – 6-Week Change in Strength Index: | -19.3 | 18.4 | -5.9 |
Dow Jones Stock Mini Futures:
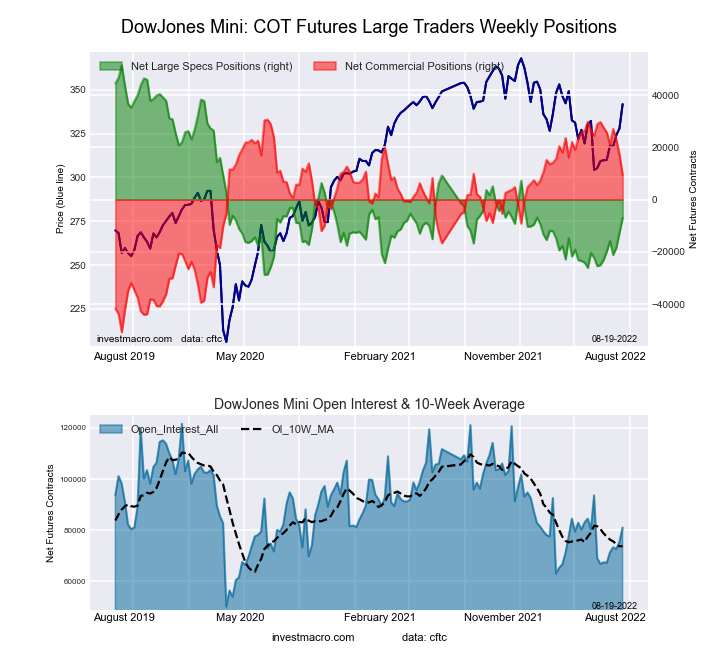
The Dow Jones Mini large speculator standing this week equaled a net position of -6,965 contracts in the data reported through Tuesday. This was a weekly rise of 5,745 contracts from the previous week which had a total of -12,710 net contracts.
This week’s current strength score (the trader positioning range over the past three years, measured from 0 to 100) shows the speculators are currently Bearish with a score of 29.0 percent. The commercials are Bullish with a score of 71.6 percent and the small traders (not shown in chart) are Bearish with a score of 25.6 percent.
| Dow Jones Mini Futures Statistics | SPECULATORS | COMMERCIALS | SMALL TRADERS |
| – Percent of Open Interest Longs: | 28.6 | 54.0 | 16.4 |
| – Percent of Open Interest Shorts: | 37.2 | 42.5 | 19.4 |
| – Net Position: | -6,965 | 9,366 | -2,401 |
| – Gross Longs: | 23,215 | 43,795 | 13,286 |
| – Gross Shorts: | 30,180 | 34,429 | 15,687 |
| – Long to Short Ratio: | 0.8 to 1 | 1.3 to 1 | 0.8 to 1 |
| NET POSITION TREND: | |||
| – Strength Index Score (3 Year Range Pct): | 29.0 | 71.6 | 25.6 |
| – Strength Index Reading (3 Year Range): | Bearish | Bullish | Bearish |
| NET POSITION MOVEMENT INDEX: | |||
| – 6-Week Change in Strength Index: | 21.5 | -24.4 | 11.1 |
Nasdaq Mini Futures:
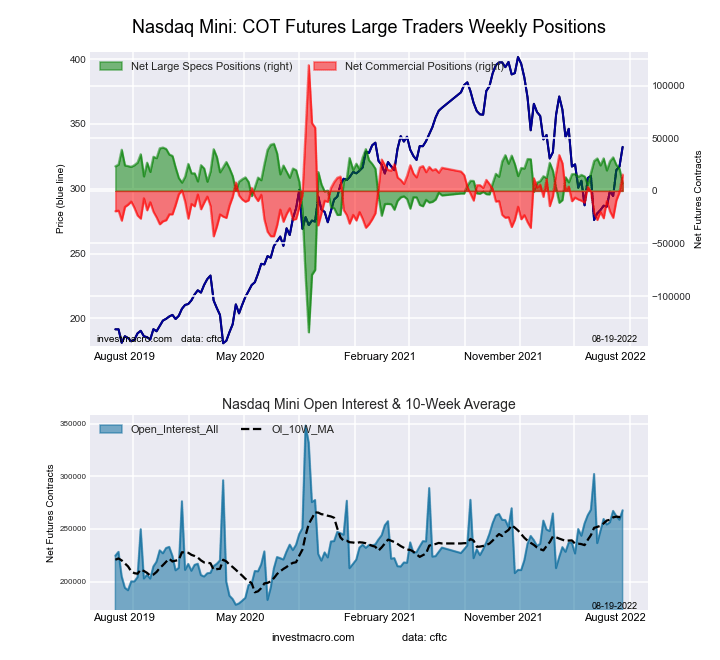
The Nasdaq Mini large speculator standing this week equaled a net position of 6,846 contracts in the data reported through Tuesday. This was a weekly decline of -14,229 contracts from the previous week which had a total of 21,075 net contracts.
This week’s current strength score (the trader positioning range over the past three years, measured from 0 to 100) shows the speculators are currently Bullish with a score of 78.9 percent. The commercials are Bearish with a score of 36.1 percent and the small traders (not shown in chart) are Bearish-Extreme with a score of 2.4 percent.
| Nasdaq Mini Futures Statistics | SPECULATORS | COMMERCIALS | SMALL TRADERS |
| – Percent of Open Interest Longs: | 29.3 | 57.6 | 11.3 |
| – Percent of Open Interest Shorts: | 26.7 | 51.8 | 19.6 |
| – Net Position: | 6,846 | 15,522 | -22,368 |
| – Gross Longs: | 78,401 | 154,315 | 30,163 |
| – Gross Shorts: | 71,555 | 138,793 | 52,531 |
| – Long to Short Ratio: | 1.1 to 1 | 1.1 to 1 | 0.6 to 1 |
| NET POSITION TREND: | |||
| – Strength Index Score (3 Year Range Pct): | 78.9 | 36.1 | 2.4 |
| – Strength Index Reading (3 Year Range): | Bullish | Bearish | Bearish-Extreme |
| NET POSITION MOVEMENT INDEX: | |||
| – 6-Week Change in Strength Index: | -13.4 | 25.5 | -35.8 |
Russell 2000 Mini Futures:
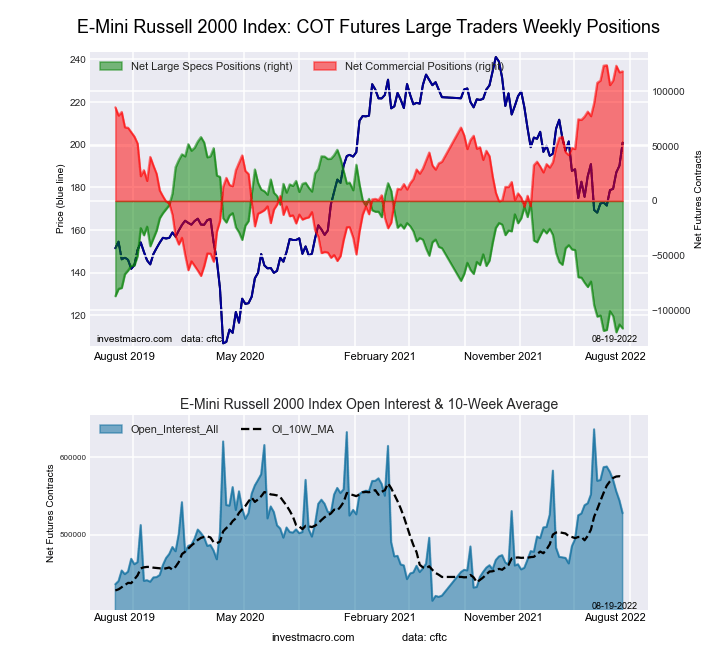
The Russell 2000 Mini large speculator standing this week equaled a net position of -116,465 contracts in the data reported through Tuesday. This was a weekly fall of -3,598 contracts from the previous week which had a total of -112,867 net contracts.
This week’s current strength score (the trader positioning range over the past three years, measured from 0 to 100) shows the speculators are currently Bearish-Extreme with a score of 2.0 percent. The commercials are Bullish-Extreme with a score of 97.1 percent and the small traders (not shown in chart) are Bearish with a score of 21.6 percent.
| Russell 2000 Mini Futures Statistics | SPECULATORS | COMMERCIALS | SMALL TRADERS |
| – Percent of Open Interest Longs: | 6.1 | 88.5 | 4.3 |
| – Percent of Open Interest Shorts: | 28.1 | 66.0 | 4.6 |
| – Net Position: | -116,465 | 118,367 | -1,902 |
| – Gross Longs: | 32,034 | 466,874 | 22,592 |
| – Gross Shorts: | 148,499 | 348,507 | 24,494 |
| – Long to Short Ratio: | 0.2 to 1 | 1.3 to 1 | 0.9 to 1 |
| NET POSITION TREND: | |||
| – Strength Index Score (3 Year Range Pct): | 2.0 | 97.1 | 21.6 |
| – Strength Index Reading (3 Year Range): | Bearish-Extreme | Bullish-Extreme | Bearish |
| NET POSITION MOVEMENT INDEX: | |||
| – 6-Week Change in Strength Index: | 1.2 | -2.7 | 9.3 |
Nikkei Stock Average (USD) Futures:
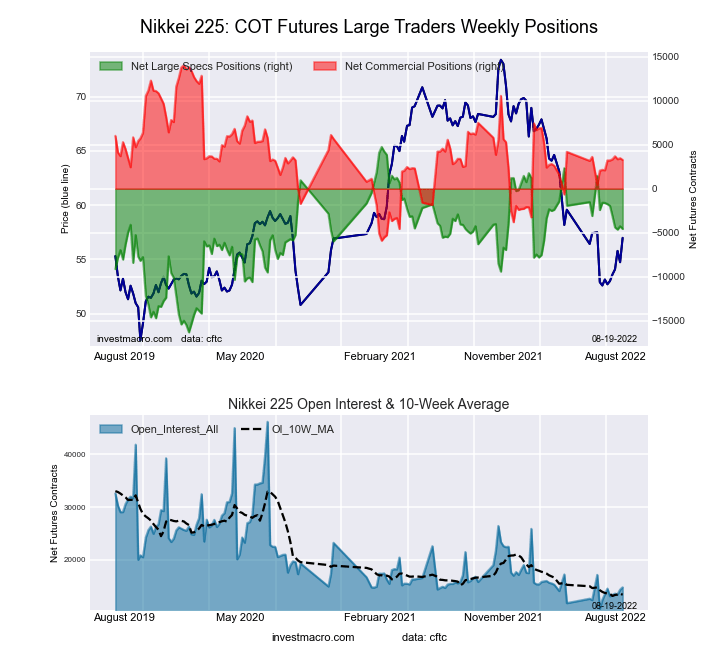
The Nikkei Stock Average (USD) large speculator standing this week equaled a net position of -4,563 contracts in the data reported through Tuesday. This was a weekly decline of -303 contracts from the previous week which had a total of -4,260 net contracts.
This week’s current strength score (the trader positioning range over the past three years, measured from 0 to 100) shows the speculators are currently Bullish with a score of 55.8 percent. The commercials are Bearish with a score of 46.0 percent and the small traders (not shown in chart) are Bearish with a score of 44.6 percent.
| Nikkei Stock Average Futures Statistics | SPECULATORS | COMMERCIALS | SMALL TRADERS |
| – Percent of Open Interest Longs: | 15.4 | 53.9 | 30.4 |
| – Percent of Open Interest Shorts: | 46.4 | 31.7 | 21.7 |
| – Net Position: | -4,563 | 3,271 | 1,292 |
| – Gross Longs: | 2,278 | 7,948 | 4,489 |
| – Gross Shorts: | 6,841 | 4,677 | 3,197 |
| – Long to Short Ratio: | 0.3 to 1 | 1.7 to 1 | 1.4 to 1 |
| NET POSITION TREND: | |||
| – Strength Index Score (3 Year Range Pct): | 55.8 | 46.0 | 44.6 |
| – Strength Index Reading (3 Year Range): | Bullish | Bearish | Bearish |
| NET POSITION MOVEMENT INDEX: | |||
| – 6-Week Change in Strength Index: | -13.4 | 0.3 | 34.6 |
MSCI EAFE Mini Futures:
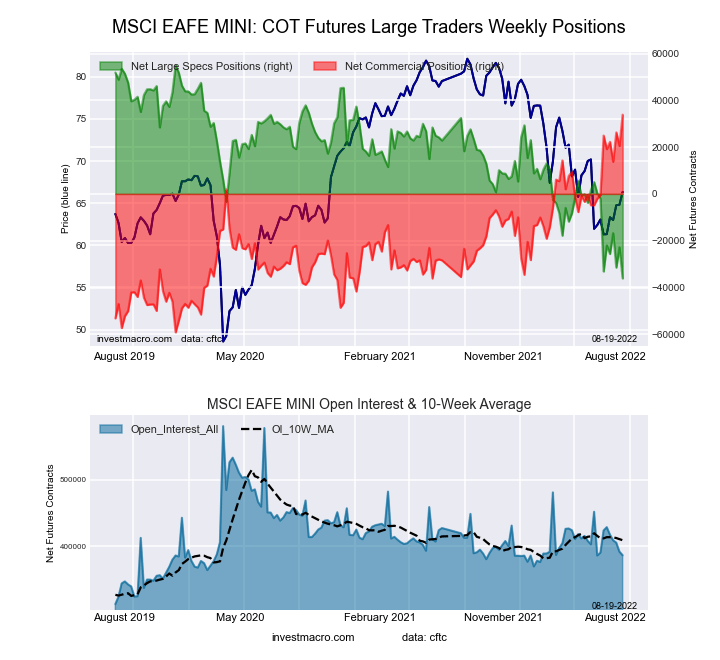
The MSCI EAFE Mini large speculator standing this week equaled a net position of -36,158 contracts in the data reported through Tuesday. This was a weekly lowering of -13,310 contracts from the previous week which had a total of -22,848 net contracts.
This week’s current strength score (the trader positioning range over the past three years, measured from 0 to 100) shows the speculators are currently Bearish-Extreme with a score of 0.0 percent. The commercials are Bullish-Extreme with a score of 100.0 percent and the small traders (not shown in chart) are Bearish with a score of 38.9 percent.
| MSCI EAFE Mini Futures Statistics | SPECULATORS | COMMERCIALS | SMALL TRADERS |
| – Percent of Open Interest Longs: | 4.9 | 92.4 | 2.2 |
| – Percent of Open Interest Shorts: | 14.3 | 83.7 | 1.6 |
| – Net Position: | -36,158 | 33,865 | 2,293 |
| – Gross Longs: | 19,133 | 357,541 | 8,342 |
| – Gross Shorts: | 55,291 | 323,676 | 6,049 |
| – Long to Short Ratio: | 0.3 to 1 | 1.1 to 1 | 1.4 to 1 |
| NET POSITION TREND: | |||
| – Strength Index Score (3 Year Range Pct): | 0.0 | 100.0 | 38.9 |
| – Strength Index Reading (3 Year Range): | Bearish-Extreme | Bullish-Extreme | Bearish |
| NET POSITION MOVEMENT INDEX: | |||
| – 6-Week Change in Strength Index: | -3.3 | 9.6 | -52.3 |
*COT Report: The COT data, released weekly to the public each Friday, is updated through the most recent Tuesday (data is 3 days old) and shows a quick view of how large speculators or non-commercials (for-profit traders) were positioned in the futures markets.
The CFTC categorizes trader positions according to commercial hedgers (traders who use futures contracts for hedging as part of the business), non-commercials (large traders who speculate to realize trading profits) and nonreportable traders (usually small traders/speculators) as well as their open interest (contracts open in the market at time of reporting).See CFTC criteria here.
More By This Author:
Gold & Silver Large Speculator Bets Continue To Gain After Falling To Multi-Year Lows
Currency Speculators Further Pared Back On Japanese Yen & British Pound Bearish Bets
Soft Commodities Speculator Bets Go Slightly Higher Led By Live Cattle & Lean Hogs


Comments
Log in or sign up to join the conversation.