
Here are the latest charts and statistics for the Commitment of Traders (COT) data published by the Commodities Futures Trading Commission (CFTC).
The latest COT data is updated through Tuesday July 12th and shows a quick view of how large traders (for-profit speculators and commercial entities) were positioned in the futures markets.
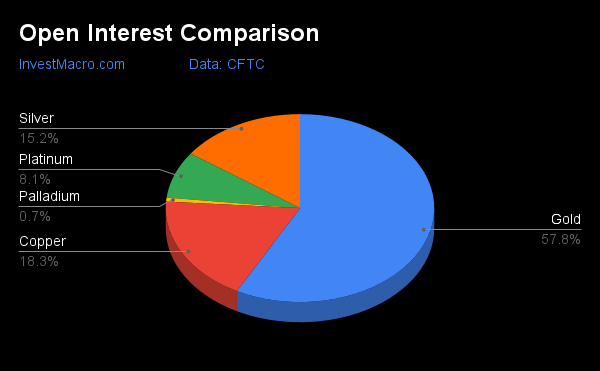
Weekly Speculator Changes
COT precious metals speculator bets were lower again this week as two out of the five metals markets we cover had higher positioning while the other three markets had lower contracts.
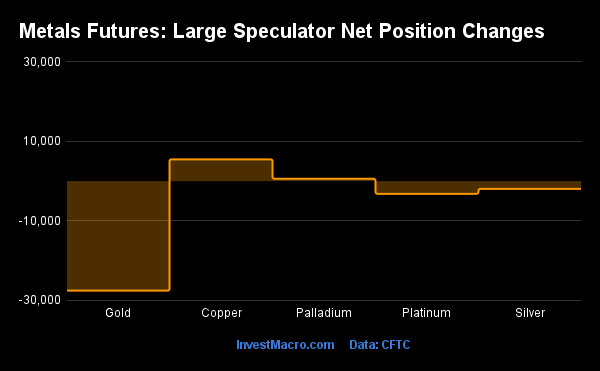
Leading the gains for the precious metals markets was Copper with a weekly gain of 5,501 contracts while Palladium (608 contracts) also showed a positive week.
The metals markets leading the declines in speculator bets this week were Gold (-27,539 contracts) and Platinum (-3,177 contracts) with Silver (-1,935 contracts) also registering lower bets on the week.
Highlighting the metals data this week is the continued drop in the Gold speculator positions. Gold speculator bets have fallen for three straight weeks and in ten out of the past thirteen weeks. This amounts to a total decline of -136,166 contracts over that 13-week period. The current bullish standing for Gold has dipped all the way to +118,121 contracts which is a steeply lower compared to the 2022 weekly average of +204,891 contracts. The current speculator standing is at the lowest level in the past one hundred and sixty-three weeks, dating back to May 28th of 2019 when spec bets totaled just +86,688 contracts.
Silver contracts have also been in a deep decline as well with speculator bets falling for three straight weeks and for ten out of the past eleven weeks (a total -43,225 contract decline over past 11 weeks). This weakness has brought the overall net position very close to falling into negative or bearish territory at a total of just +3,204 contracts currently. Silver bets, like Gold, are at the lowest level in one hundred and sixty-one weeks, dating back to June 11th of 2019.
Data Snapshot of Commodity Market Traders | Columns Legend
| WTI Crude | 1,612,803 | 0 | 268,328 | 0 | -294,526 | 100 | 26,198 | 52 |
| Corn | 1,333,199 | 0 | 247,156 | 62 | -196,533 | 44 | -50,623 | 14 |
| Natural Gas | 969,204 | 0 | -131,603 | 39 | 94,195 | 61 | 37,408 | 69 |
| Sugar | 701,144 | 0 | 105,869 | 58 | -115,779 | 46 | 9,910 | 20 |
| Soybeans | 611,751 | 1 | 115,119 | 49 | -87,284 | 57 | -27,835 | 24 |
| Gold | 542,493 | 26 | 118,121 | 0 | -137,788 | 100 | 19,667 | 0 |
| Wheat | 288,182 | 0 | 4,639 | 25 | 5,041 | 67 | -9,680 | 60 |
| Heating Oil | 266,330 | 22 | 6,728 | 52 | -22,853 | 47 | 16,125 | 54 |
| Coffee | 195,810 | 2 | 34,308 | 68 | -35,166 | 37 | 858 | 0 |
| Copper | 172,037 | 6 | -26,295 | 23 | 27,061 | 78 | -766 | 21 |
| Brent | 171,950 | 17 | -38,388 | 47 | 36,619 | 54 | 1,769 | 33 |
| Silver | 142,259 | 9 | 3,204 | 0 | -9,612 | 100 | 6,408 | 0 |
| Platinum | 75,615 | 48 | -5,911 | 0 | 1,235 | 100 | 4,676 | 27 |
| Palladium | 6,474 | 1 | -2,802 | 7 | 3,252 | 93 | -450 | 18 |
Strength Scores
Strength scores (a measure of the 3-Year range of Speculator positions, from 0 to 100 where above 80 is extreme bullish and below 20 is extreme bearish) show the very weak speculator sentiment levels for the precious metals at the moment. Four out of the five metals markets currently have bearish extreme positioning (below 20 percent) as has been the case for many weeks. Copper (23.4 percent) is the only market not in a bearish extreme level currently but remains in the bottom quartile of its 3-year range of speculator positions. Gold, Silver and Platinum are all at zero percent levels which means that speculator bets are at 3-year lows.

Strength Statistics:
Gold (0.0 percent) vs Gold previous week (11.7 percent)
Silver (0.0 percent) vs Silver previous week (2.6 percent)
Copper (23.4 percent) vs Copper previous week (19.5 percent)
Platinum (0.0 percent) vs Platinum previous week (4.3 percent)
Palladium (7.1 percent) vs Palladium previous week (3.6 percent)
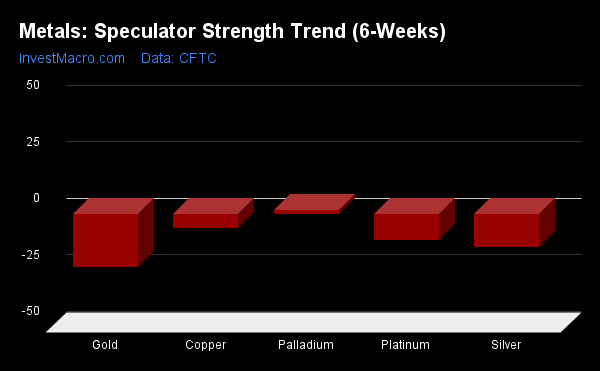
Strength Trends
Strength Score Trends (or move index, calculates the 6-week changes in strength scores) show that the Palladium (1.9 percent) leads the past six weeks trends for metals this week and has the only positive trend among metals. Gold (-23.1 percent), Silver (-14.5 percent) and Platinum (-11.3 percent) lead the downside trend scores currently while Copper (-6.0 percent).
Move Statistics:
Gold (-23.1 percent) vs Gold previous week (-16.2 percent)
Silver (-14.5 percent) vs Silver previous week (-12.0 percent)
Copper (-6.0 percent) vs Copper previous week (-8.8 percent)
Platinum (-11.3 percent) vs Platinum previous week (-5.7 percent)
Palladium (1.9 percent) vs Palladium previous week (0.3 percent)
Gold Comex Futures:
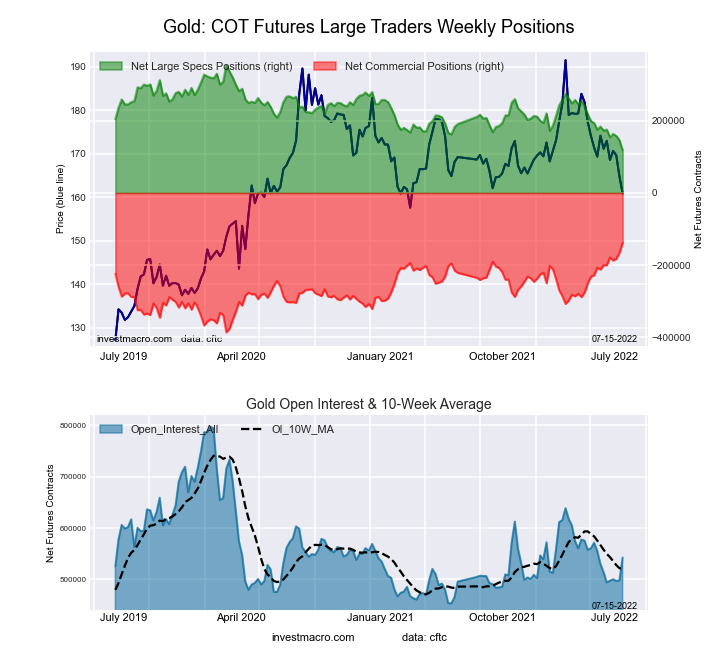
The Gold Comex Futures large speculator standing this week totaled a net position of 118,121 contracts in the data reported through Tuesday. This was a weekly decrease of -27,539 contracts from the previous week which had a total of 145,660 net contracts.
This week’s current strength score (the trader positioning range over the past three years, measured from 0 to 100) shows the speculators are currently Bearish-Extreme with a score of 0.0 percent. The commercials are Bullish-Extreme with a score of 100.0 percent and the small traders (not shown in chart) are Bearish-Extreme with a score of 0.0 percent.
| Gold Futures Statistics | SPECULATORS | COMMERCIALS | SMALL TRADERS |
| – Percent of Open Interest Longs: | 46.3 | 24.2 | 9.7 |
| – Percent of Open Interest Shorts: | 24.5 | 49.6 | 6.1 |
| – Net Position: | 118,121 | -137,788 | 19,667 |
| – Gross Longs: | 251,126 | 131,170 | 52,583 |
| – Gross Shorts: | 133,005 | 268,958 | 32,916 |
| – Long to Short Ratio: | 1.9 to 1 | 0.5 to 1 | 1.6 to 1 |
| NET POSITION TREND: | |||
| – Strength Index Score (3 Year Range Pct): | 0.0 | 100.0 | 0.0 |
| – Strength Index Reading (3 Year Range): | Bearish-Extreme | Bullish-Extreme | Bearish-Extreme |
| NET POSITION MOVEMENT INDEX: | |||
| – 6-Week Change in Strength Index: | -23.1 | 25.1 | -27.7 |
Silver Comex Futures:
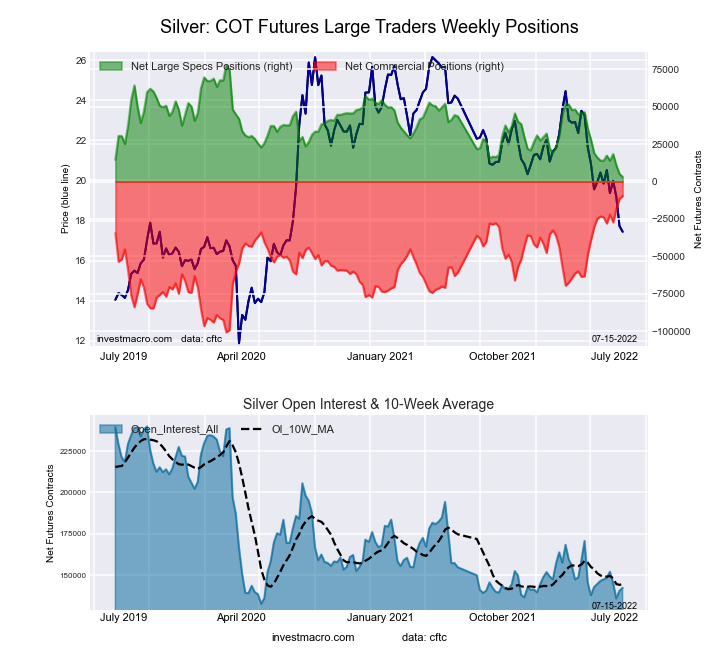
The Silver Comex Futures large speculator standing this week totaled a net position of 3,204 contracts in the data reported through Tuesday. This was a weekly decrease of -1,935 contracts from the previous week which had a total of 5,139 net contracts.
This week’s current strength score (the trader positioning range over the past three years, measured from 0 to 100) shows the speculators are currently Bearish-Extreme with a score of 0.0 percent. The commercials are Bullish-Extreme with a score of 100.0 percent and the small traders (not shown in chart) are Bearish-Extreme with a score of 0.0 percent.
| Silver Futures Statistics | SPECULATORS | COMMERCIALS | SMALL TRADERS |
| – Percent of Open Interest Longs: | 38.5 | 40.7 | 15.3 |
| – Percent of Open Interest Shorts: | 36.2 | 47.4 | 10.8 |
| – Net Position: | 3,204 | -9,612 | 6,408 |
| – Gross Longs: | 54,744 | 57,865 | 21,748 |
| – Gross Shorts: | 51,540 | 67,477 | 15,340 |
| – Long to Short Ratio: | 1.1 to 1 | 0.9 to 1 | 1.4 to 1 |
| NET POSITION TREND: | |||
| – Strength Index Score (3 Year Range Pct): | 0.0 | 100.0 | 0.0 |
| – Strength Index Reading (3 Year Range): | Bearish-Extreme | Bullish-Extreme | Bearish-Extreme |
| NET POSITION MOVEMENT INDEX: | |||
| – 6-Week Change in Strength Index: | -14.5 | 15.6 | -16.8 |
Copper Grade #1 Futures:
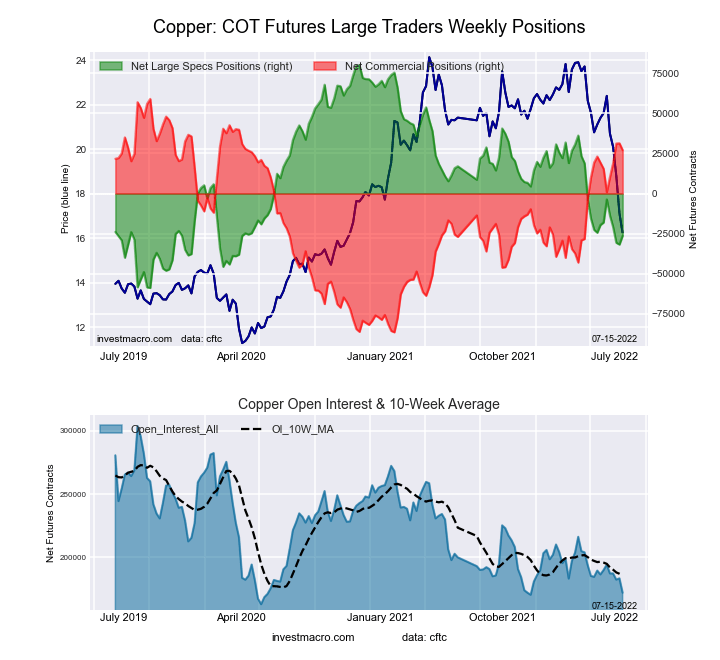
The Copper Grade #1 Futures large speculator standing this week totaled a net position of -26,295 contracts in the data reported through Tuesday. This was a weekly rise of 5,501 contracts from the previous week which had a total of -31,796 net contracts.
This week’s current strength score (the trader positioning range over the past three years, measured from 0 to 100) shows the speculators are currently Bearish with a score of 23.4 percent. The commercials are Bullish with a score of 78.1 percent and the small traders (not shown in chart) are Bearish with a score of 20.9 percent.
| Copper Futures Statistics | SPECULATORS | COMMERCIALS | SMALL TRADERS |
| – Percent of Open Interest Longs: | 30.6 | 50.8 | 8.1 |
| – Percent of Open Interest Shorts: | 45.9 | 35.1 | 8.6 |
| – Net Position: | -26,295 | 27,061 | -766 |
| – Gross Longs: | 52,623 | 87,389 | 13,967 |
| – Gross Shorts: | 78,918 | 60,328 | 14,733 |
| – Long to Short Ratio: | 0.7 to 1 | 1.4 to 1 | 0.9 to 1 |
| NET POSITION TREND: | |||
| – Strength Index Score (3 Year Range Pct): | 23.4 | 78.1 | 20.9 |
| – Strength Index Reading (3 Year Range): | Bearish | Bullish | Bearish |
| NET POSITION MOVEMENT INDEX: | |||
| – 6-Week Change in Strength Index: | -6.0 | 8.0 | -19.5 |
Platinum Futures:
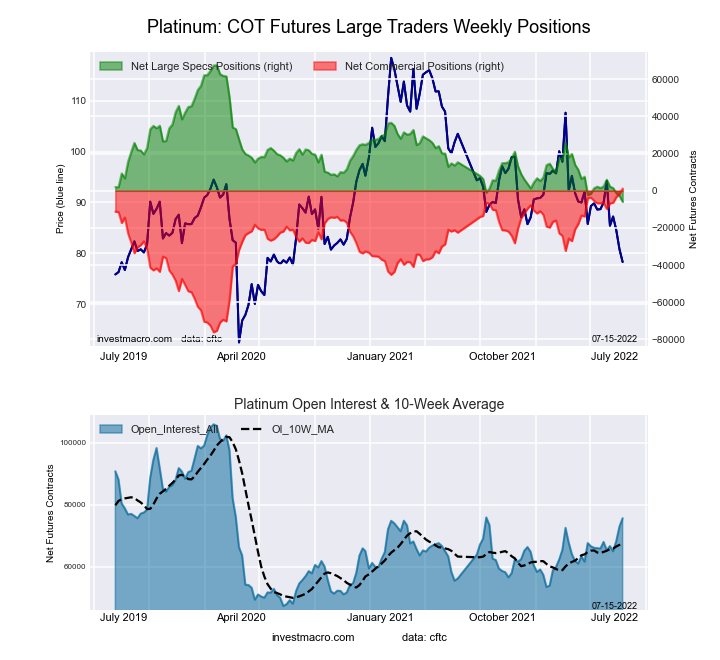
The Platinum Futures large speculator standing this week totaled a net position of -5,911 contracts in the data reported through Tuesday. This was a weekly fall of -3,177 contracts from the previous week which had a total of -2,734 net contracts.
This week’s current strength score (the trader positioning range over the past three years, measured from 0 to 100) shows the speculators are currently Bearish-Extreme with a score of 0.0 percent. The commercials are Bullish-Extreme with a score of 100.0 percent and the small traders (not shown in chart) are Bearish with a score of 27.2 percent.
| Platinum Futures Statistics | SPECULATORS | COMMERCIALS | SMALL TRADERS |
| – Percent of Open Interest Longs: | 43.1 | 39.4 | 11.2 |
| – Percent of Open Interest Shorts: | 50.9 | 37.7 | 5.0 |
| – Net Position: | -5,911 | 1,235 | 4,676 |
| – Gross Longs: | 32,580 | 29,758 | 8,464 |
| – Gross Shorts: | 38,491 | 28,523 | 3,788 |
| – Long to Short Ratio: | 0.8 to 1 | 1.0 to 1 | 2.2 to 1 |
| NET POSITION TREND: | |||
| – Strength Index Score (3 Year Range Pct): | 0.0 | 100.0 | 27.2 |
| – Strength Index Reading (3 Year Range): | Bearish-Extreme | Bullish-Extreme | Bearish |
| NET POSITION MOVEMENT INDEX: | |||
| – 6-Week Change in Strength Index: | -11.3 | 10.0 | 7.5 |
Palladium Futures:
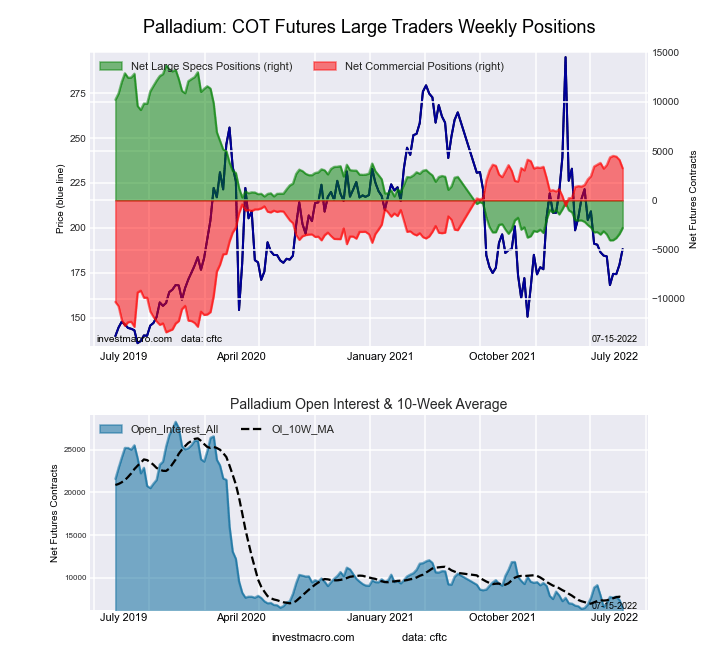
The Palladium Futures large speculator standing this week totaled a net position of -2,802 contracts in the data reported through Tuesday. This was a weekly lift of 608 contracts from the previous week which had a total of -3,410 net contracts.
This week’s current strength score (the trader positioning range over the past three years, measured from 0 to 100) shows the speculators are currently Bearish-Extreme with a score of 7.1 percent. The commercials are Bullish-Extreme with a score of 93.0 percent and the small traders (not shown in chart) are Bearish-Extreme with a score of 17.8 percent.
| Palladium Futures Statistics | SPECULATORS | COMMERCIALS | SMALL TRADERS |
| – Percent of Open Interest Longs: | 15.5 | 70.8 | 13.2 |
| – Percent of Open Interest Shorts: | 58.7 | 20.6 | 20.1 |
| – Net Position: | -2,802 | 3,252 | -450 |
| – Gross Longs: | 1,001 | 4,586 | 853 |
| – Gross Shorts: | 3,803 | 1,334 | 1,303 |
| – Long to Short Ratio: | 0.3 to 1 | 3.4 to 1 | 0.7 to 1 |
| NET POSITION TREND: | |||
| – Strength Index Score (3 Year Range Pct): | 7.1 | 93.0 | 17.8 |
| – Strength Index Reading (3 Year Range): | Bearish-Extreme | Bullish-Extreme | Bearish-Extreme |
| NET POSITION MOVEMENT INDEX: | |||
| – 6-Week Change in Strength Index: | 1.9 | 0.2 | -20.9 |
*COT Report: The COT data, released weekly to the public each Friday, is updated through the most recent Tuesday (data is 3 days old) and shows a quick view of how large speculators or non-commercials (for-profit traders) were positioned in the futures markets.
The CFTC categorizes trader positions according to commercial hedgers (traders who use futures contracts for hedging as part of the business), non-commercials (large traders who speculate to realize trading profits) and nonreportable traders (usually small traders/speculators) as well as their open interest (contracts open in the market at time of reporting).See CFTC criteria here.
More By This Author:
COT Week 27 Charts: Soft Commodities Speculators Bets Go Lower Led By Corn, Sugar & Cocoa
COT Week 27 Charts: Bond Market Speculators Bets Higher Overall Led By Ultra US Bonds & 2-Year Bonds
COT Week 27 Charts: Energy Speculator Bets Drop Led By WTI Crude Oil & Gasoline


Comments
Log in or sign up to join the conversation.