
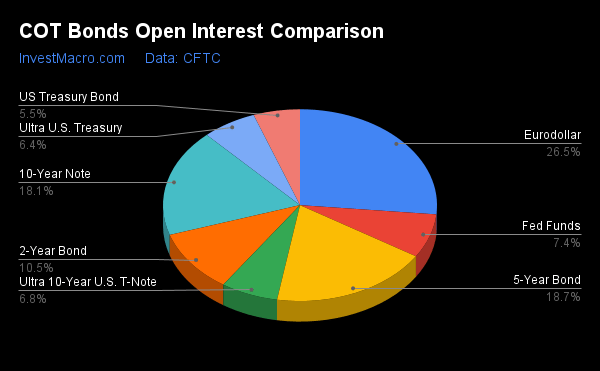
Here are the latest charts and statistics for the Commitment of Traders (COT) reports data published by the Commodities Futures Trading Commission (CFTC).
The latest COT data is updated through Tuesday January 17th and shows a quick view of how large traders (for-profit speculators and commercial hedgers) were positioned in the futures markets.
Weekly Speculator Changes led by Fed Funds & Eurodollar
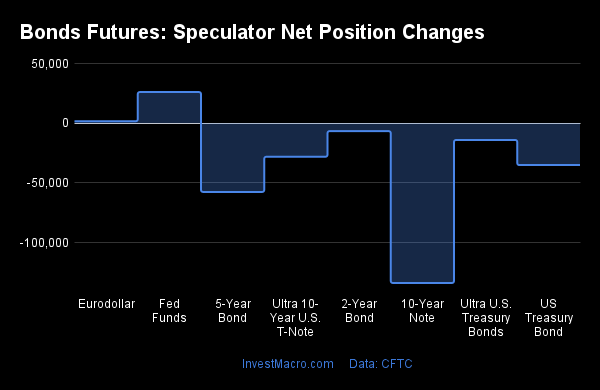
The COT bond market speculator bets were lower this week as just two out of the eight bond markets we cover had higher positioning while the other six markets had lower speculator contracts.
The bond markets with declines in speculator bets for the week were the 10-Year Bonds (-133,699 contracts), the 5-Year Bonds (-57,504 contracts), the US Treasury Bonds (-35,008 contracts), the 2-Year Bonds (-6,620 contracts), the Ultra Treasury Bonds (-14,022 contracts) and the Ultra 10-Year Bonds (-28,051 contracts) also registering lower bets on the week.
Highlighting the COT bonds data is the sharp decline in the 10-Year Treasury Bond speculator positioning. The 10-Year Bond large speculator positions fell this week by a total of -133,699 contracts and have now dropped for four consecutive weeks. The speculator bets have declined in six out of the past seven weeks as well. These last four weeks alone have added a total of -228,114 bearish contracts to the overall bearish position of -545,057 contracts. This weakness has driven the current speculator level to the most bearish point of the past 222 weeks, dating back to October 15th of 2018.
Despite the current speculator sentiment, the 10-Year Bond prices have been edging a little higher since hitting a multi-year low in October. The 10-Year interest rate (rates rise as bond prices fall) is sitting around 3.50 percent currently after peaking in October at just above 4.33 percent.
|
Jan-17-2023
|
OI
|
OI-Index
|
Spec-Net
|
Spec-Index
|
Com-Net
|
COM-Index
|
Smalls-Net
|
Smalls-Index
|
|---|---|---|---|---|---|---|---|---|
| Eurodollar | 5,891,238 | 0 | -1,053,852 | 34 | 1,265,098 | 64 | -211,246 | 58 |
| 5-Year | 4,159,392 | 60 | -680,655 | 1 | 689,573 | 90 | -8,918 | 79 |
| 10-Year | 4,018,107 | 66 | -545,057 | 0 | 615,855 | 95 | -70,798 | 63 |
| 2-Year | 2,335,967 | 25 | -462,671 | 18 | 452,042 | 79 | 10,629 | 57 |
| FedFunds | 1,645,779 | 59 | -86,235 | 29 | 105,583 | 73 | -19,348 | 12 |
| Long T-Bond | 1,222,141 | 47 | -192,393 | 22 | 170,932 | 72 | 21,461 | 70 |
Strength Scores led by Eurodollar & Fed Funds
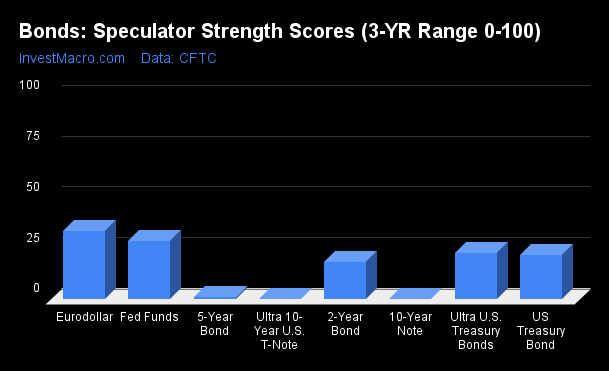
COT Strength Scores (a normalized measure of Speculator positions over a 3-Year range, from 0 to 100 where above 80 is Extreme-Bullish and below 20 is Extreme-Bearish) showed that the Eurodollar (34 percent) and the Fed Funds (29 percent) lead the bond markets this week. The Ultra Treasury Bonds (23 percent) comes in as the next highest in the weekly strength scores.
On the downside, the Ultra 10-Year Bonds (0 percent), the 10-Year Bonds (0 percent), the 5-Year Bonds (1 percent) and 2-Year Bond (18.3 percent) come in at the lowest strength level currently and are all in Extreme-Bearish territory (below 20 percent).
Strength Statistics:
Fed Funds (29.0 percent) vs Fed Funds previous week (25.8 percent)
vs 2-Year Bond previous week (19.3 percent)
5-Year Bond (1.4 percent) vs 5-Year Bond previous week (8.7 percent)
10-Year Bond (0.0 percent) vs 10-Year Bond previous week (18.4 percent)
Ultra 10-Year Bond (0.0 percent) vs Ultra 10-Year Bond previous week (7.0 percent)
US Treasury Bond (22.0 percent) vs US Treasury Bond previous week (33.4 percent)
Ultra US Treasury Bond (23.0 percent) vs Ultra US Treasury Bond previous week (29.1 percent)
Eurodollar (33.8 percent) vs Eurodollar previous week (33.7 percent)
Eurodollar & 2-Year Bonds top the 6-Week Strength Trends
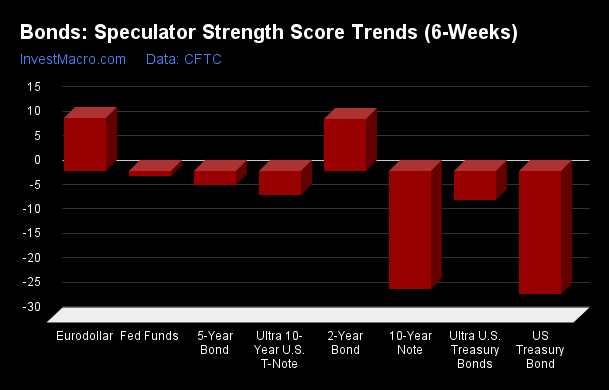
COT Strength Score Trends (or move index, calculates the 6-week changes in strength scores) showed that the Eurodollar (11 percent) and the 2-Year Bonds (11 percent) lead the past six weeks trends for bonds. The Fed Funds (-1 percent) is the next highest positive movers in the latest trends data.
The US Treasury Bonds (-25 percent) leads the downside trend scores currently with the 10-Year Bonds (-24 percent) and the Ultra Treasury Bonds (-6 percent) following next with lower trend scores.
Strength Trend Statistics:
Fed Funds (-0.9 percent) vs Fed Funds previous week (-9.8 percent)
2-Year Bond (10.7 percent) vs 2-Year Bond previous week (10.7 percent)
5-Year Bond (-2.8 percent) vs 5-Year Bond previous week (-11.9 percent)
10-Year Bond (-24.2 percent) vs 10-Year Bond previous week (-15.8 percent)
Ultra 10-Year Bond (-4.8 percent) vs Ultra 10-Year Bond previous week (-4.8 percent)
US Treasury Bond (-25.1 percent) vs US Treasury Bond previous week (-17.4 percent)
Ultra US Treasury Bond (-6.0 percent) vs Ultra US Treasury Bond previous week (7.9 percent)
Eurodollar (10.9 percent) vs Eurodollar previous week (12.0 percent)
Individual Bond Markets:
3-Month Eurodollars Futures:
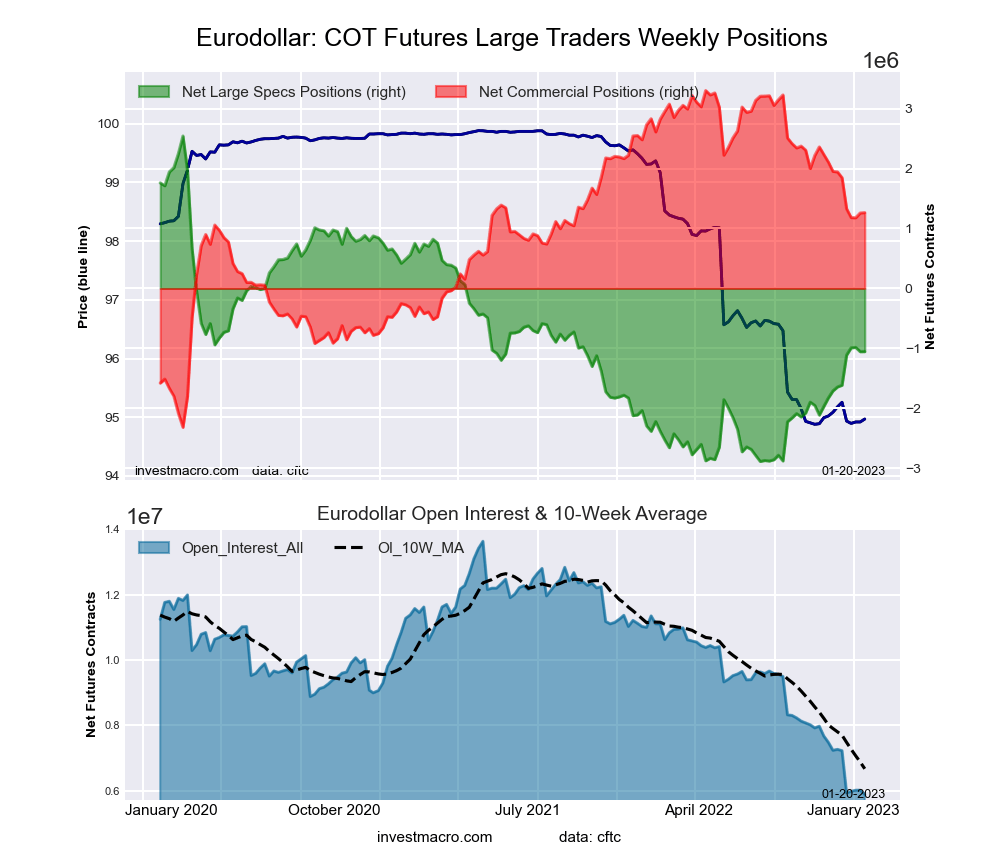
The 3-Month Eurodollars large speculator standing this week resulted in a net position of -1,053,852 contracts in the data reported through Tuesday. This was a weekly gain of 1,683 contracts from the previous week which had a total of -1,055,535 net contracts.
This week’s current strength score (the trader positioning range over the past three years, measured from 0 to 100) shows the speculators are currently Bearish with a score of 33.8 percent. The commercials are Bullish with a score of 63.8 percent and the small traders (not shown in chart) are Bullish with a score of 58.0 percent.
| 3-Month Eurodollars Statistics | SPECULATORS | COMMERCIALS | SMALL TRADERS |
| – Percent of Open Interest Longs: | 7.7 | 68.9 | 5.1 |
| – Percent of Open Interest Shorts: | 25.6 | 47.5 | 8.7 |
| – Net Position: | -1,053,852 | 1,265,098 | -211,246 |
| – Gross Longs: | 452,273 | 4,061,161 | 299,890 |
| – Gross Shorts: | 1,506,125 | 2,796,063 | 511,136 |
| – Long to Short Ratio: | 0.3 to 1 | 1.5 to 1 | 0.6 to 1 |
| NET POSITION TREND: | |||
| – Strength Index Score (3 Year Range Pct): | 33.8 | 63.8 | 58.0 |
| – Strength Index Reading (3 Year Range): | Bearish | Bullish | Bullish |
| NET POSITION MOVEMENT INDEX: | |||
| – 6-Week Change in Strength Index: | 10.9 | -12.1 | 19.6 |
30-Day Federal Funds Futures:
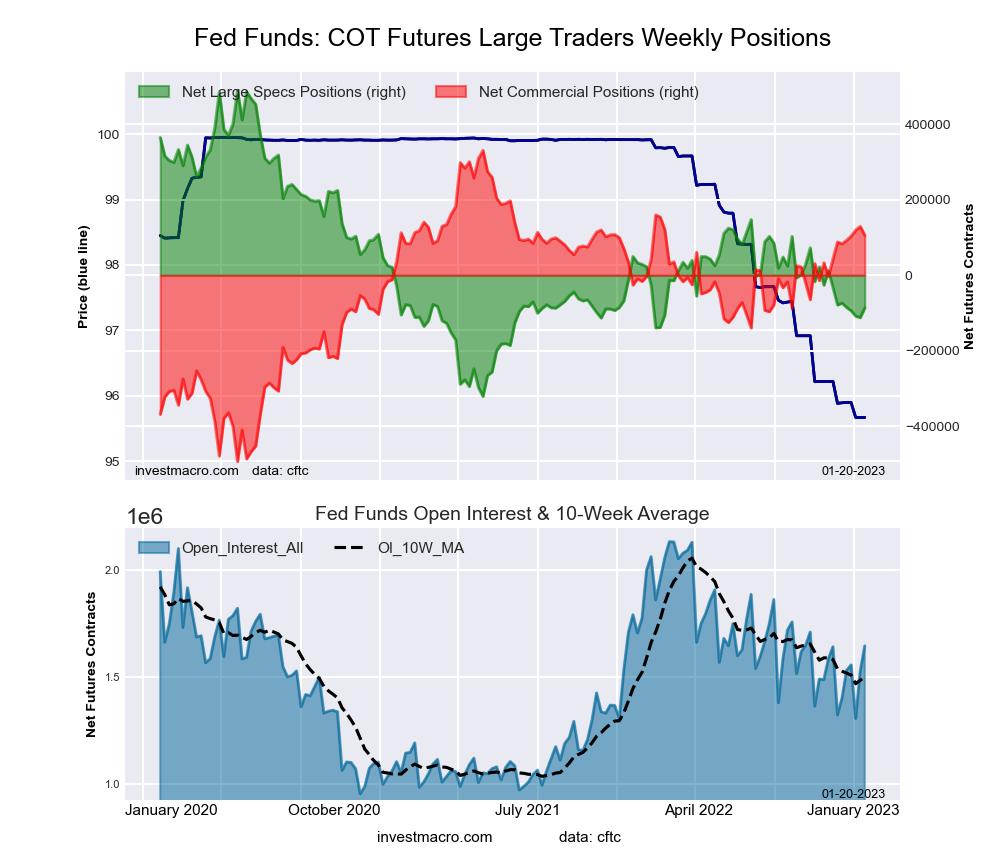
The 30-Day Federal Funds large speculator standing this week resulted in a net position of -86,235 contracts in the data reported through Tuesday. This was a weekly increase of 26,095 contracts from the previous week which had a total of -112,330 net contracts.
This week’s current strength score (the trader positioning range over the past three years, measured from 0 to 100) shows the speculators are currently Bearish with a score of 29.0 percent. The commercials are Bullish with a score of 72.7 percent and the small traders (not shown in chart) are Bearish-Extreme with a score of 11.8 percent.
| 30-Day Federal Funds Statistics | SPECULATORS | COMMERCIALS | SMALL TRADERS |
| – Percent of Open Interest Longs: | 10.2 | 74.7 | 1.8 |
| – Percent of Open Interest Shorts: | 15.4 | 68.3 | 3.0 |
| – Net Position: | -86,235 | 105,583 | -19,348 |
| – Gross Longs: | 167,385 | 1,229,497 | 30,086 |
| – Gross Shorts: | 253,620 | 1,123,914 | 49,434 |
| – Long to Short Ratio: | 0.7 to 1 | 1.1 to 1 | 0.6 to 1 |
| NET POSITION TREND: | |||
| – Strength Index Score (3 Year Range Pct): | 29.0 | 72.7 | 11.8 |
| – Strength Index Reading (3 Year Range): | Bearish | Bullish | Bearish-Extreme |
| NET POSITION MOVEMENT INDEX: | |||
| – 6-Week Change in Strength Index: | -0.9 | 2.2 | -30.2 |
2-Year Treasury Note Futures:
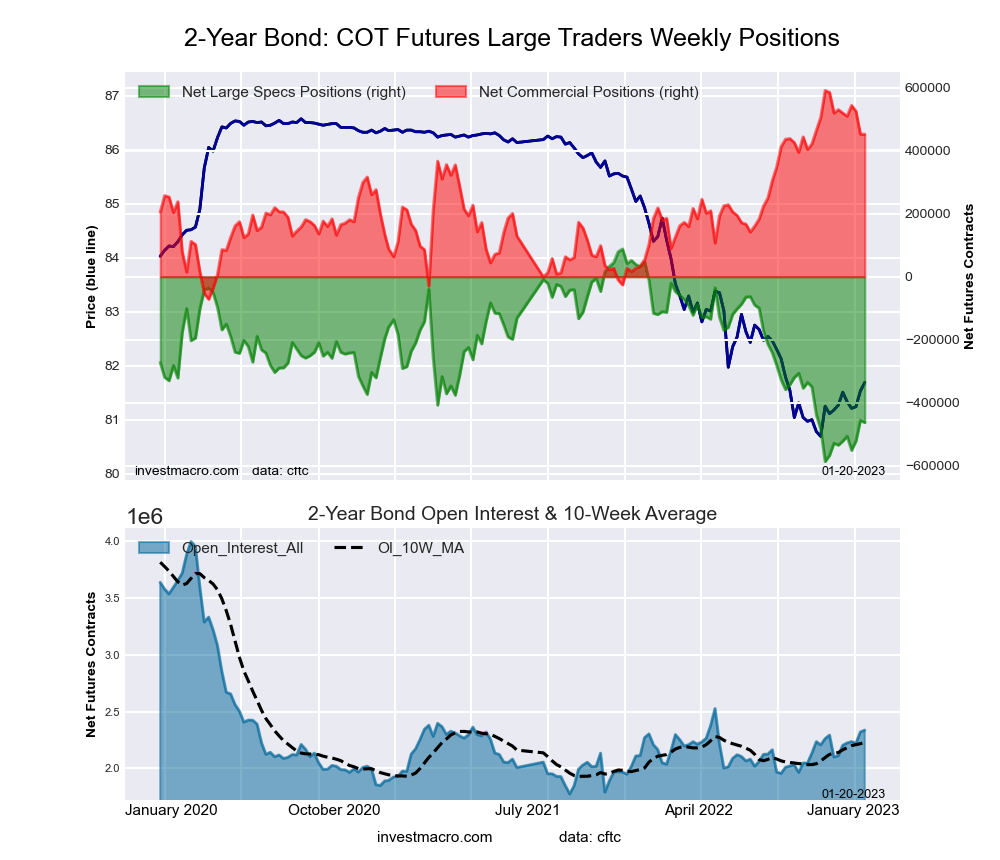
The 2-Year Treasury Note large speculator standing this week resulted in a net position of -462,671 contracts in the data reported through Tuesday. This was a weekly reduction of -6,620 contracts from the previous week which had a total of -456,051 net contracts.
This week’s current strength score (the trader positioning range over the past three years, measured from 0 to 100) shows the speculators are currently Bearish-Extreme with a score of 18.3 percent. The commercials are Bullish with a score of 79.0 percent and the small traders (not shown in chart) are Bullish with a score of 56.8 percent.
| 2-Year Treasury Note Statistics | SPECULATORS | COMMERCIALS | SMALL TRADERS |
| – Percent of Open Interest Longs: | 7.7 | 81.7 | 8.7 |
| – Percent of Open Interest Shorts: | 27.5 | 62.4 | 8.3 |
| – Net Position: | -462,671 | 452,042 | 10,629 |
| – Gross Longs: | 179,898 | 1,909,141 | 204,038 |
| – Gross Shorts: | 642,569 | 1,457,099 | 193,409 |
| – Long to Short Ratio: | 0.3 to 1 | 1.3 to 1 | 1.1 to 1 |
| NET POSITION TREND: | |||
| – Strength Index Score (3 Year Range Pct): | 18.3 | 79.0 | 56.8 |
| – Strength Index Reading (3 Year Range): | Bearish-Extreme | Bullish | Bullish |
| NET POSITION MOVEMENT INDEX: | |||
| – 6-Week Change in Strength Index: | 10.7 | -11.8 | 2.7 |
5-Year Treasury Note Futures:
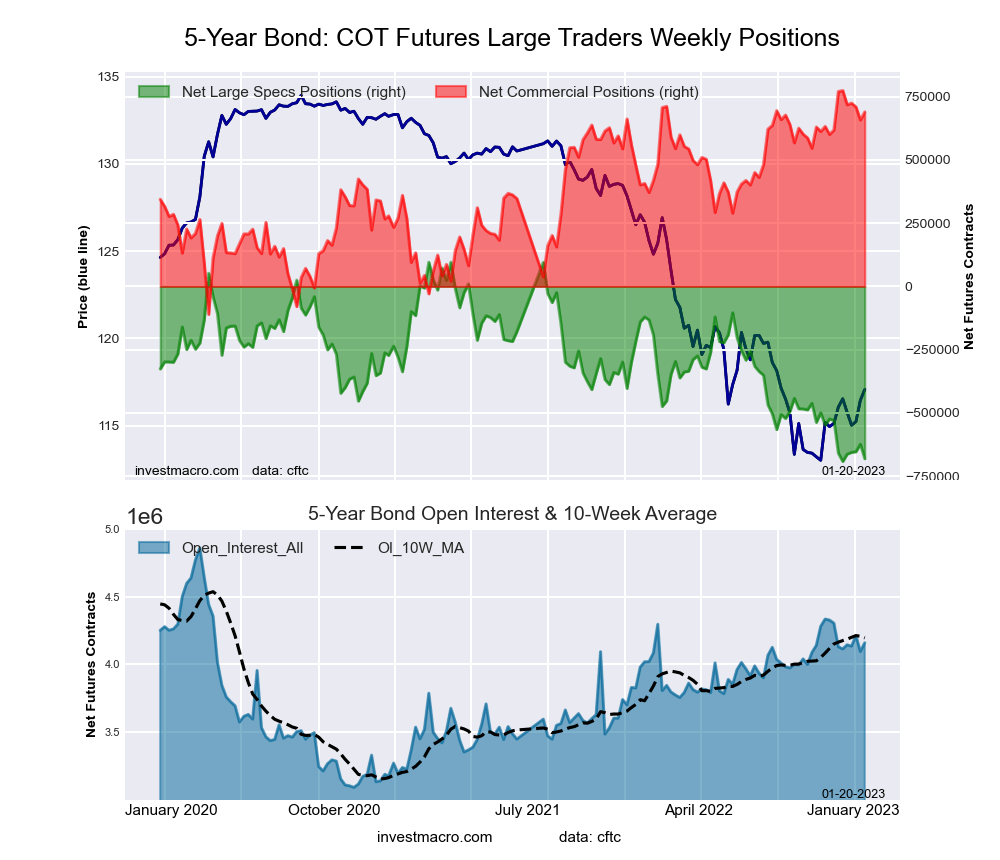
The 5-Year Treasury Note large speculator standing this week resulted in a net position of -680,655 contracts in the data reported through Tuesday. This was a weekly lowering of -57,504 contracts from the previous week which had a total of -623,151 net contracts.
This week’s current strength score (the trader positioning range over the past three years, measured from 0 to 100) shows the speculators are currently Bearish-Extreme with a score of 1.4 percent. The commercials are Bullish-Extreme with a score of 90.4 percent and the small traders (not shown in chart) are Bullish with a score of 78.6 percent.
| 5-Year Treasury Note Statistics | SPECULATORS | COMMERCIALS | SMALL TRADERS |
| – Percent of Open Interest Longs: | 5.3 | 85.1 | 8.2 |
| – Percent of Open Interest Shorts: | 21.7 | 68.5 | 8.4 |
| – Net Position: | -680,655 | 689,573 | -8,918 |
| – Gross Longs: | 220,650 | 3,538,627 | 341,784 |
| – Gross Shorts: | 901,305 | 2,849,054 | 350,702 |
| – Long to Short Ratio: | 0.2 to 1 | 1.2 to 1 | 1.0 to 1 |
| NET POSITION TREND: | |||
| – Strength Index Score (3 Year Range Pct): | 1.4 | 90.4 | 78.6 |
| – Strength Index Reading (3 Year Range): | Bearish-Extreme | Bullish-Extreme | Bullish |
| NET POSITION MOVEMENT INDEX: | |||
| – 6-Week Change in Strength Index: | -2.8 | -9.1 | 28.2 |
10-Year Treasury Note Futures:
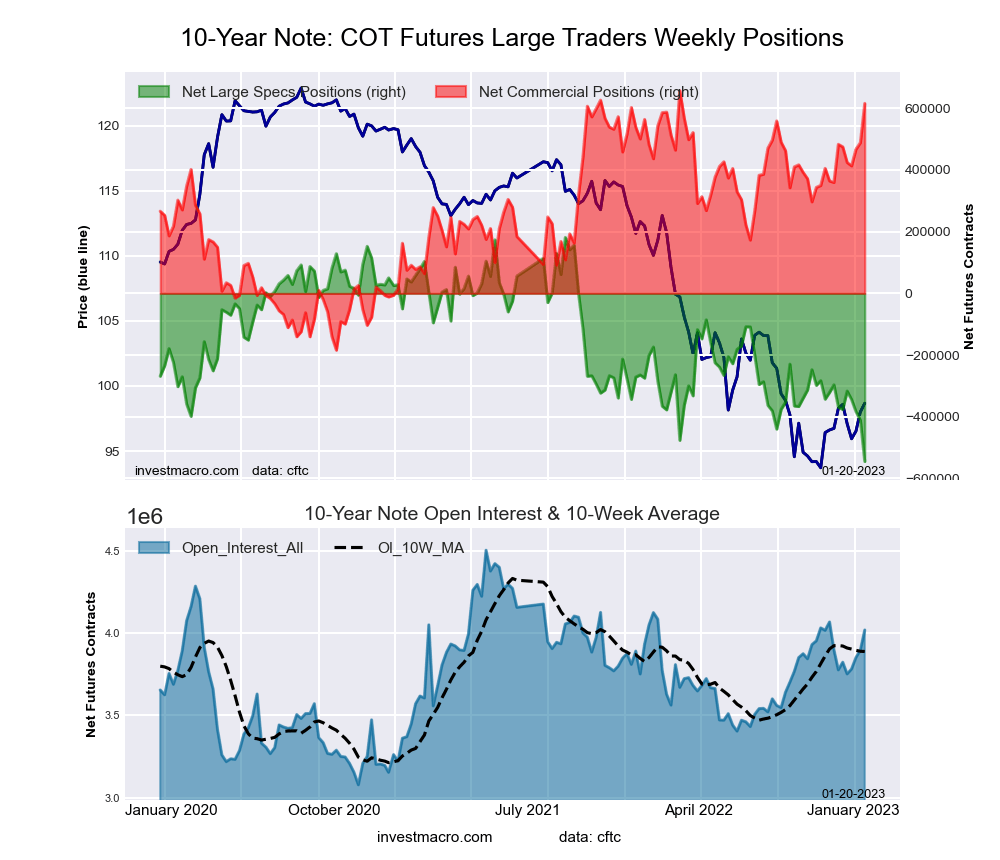
The 10-Year Treasury Note large speculator standing this week resulted in a net position of -545,057 contracts in the data reported through Tuesday. This was a weekly decrease of -133,699 contracts from the previous week which had a total of -411,358 net contracts.
This week’s current strength score (the trader positioning range over the past three years, measured from 0 to 100) shows the speculators are currently Bearish-Extreme with a score of 0.0 percent. The commercials are Bullish-Extreme with a score of 95.0 percent and the small traders (not shown in chart) are Bullish with a score of 63.3 percent.
| 10-Year Treasury Note Statistics | SPECULATORS | COMMERCIALS | SMALL TRADERS |
| – Percent of Open Interest Longs: | 8.3 | 80.6 | 9.0 |
| – Percent of Open Interest Shorts: | 21.9 | 65.3 | 10.7 |
| – Net Position: | -545,057 | 615,855 | -70,798 |
| – Gross Longs: | 334,022 | 3,237,951 | 360,271 |
| – Gross Shorts: | 879,079 | 2,622,096 | 431,069 |
| – Long to Short Ratio: | 0.4 to 1 | 1.2 to 1 | 0.8 to 1 |
| NET POSITION TREND: | |||
| – Strength Index Score (3 Year Range Pct): | 0.0 | 95.0 | 63.3 |
| – Strength Index Reading (3 Year Range): | Bearish-Extreme | Bullish-Extreme | Bullish |
| NET POSITION MOVEMENT INDEX: | |||
| – 6-Week Change in Strength Index: | -24.2 | 15.8 | 10.2 |
Ultra 10-Year Notes Futures:
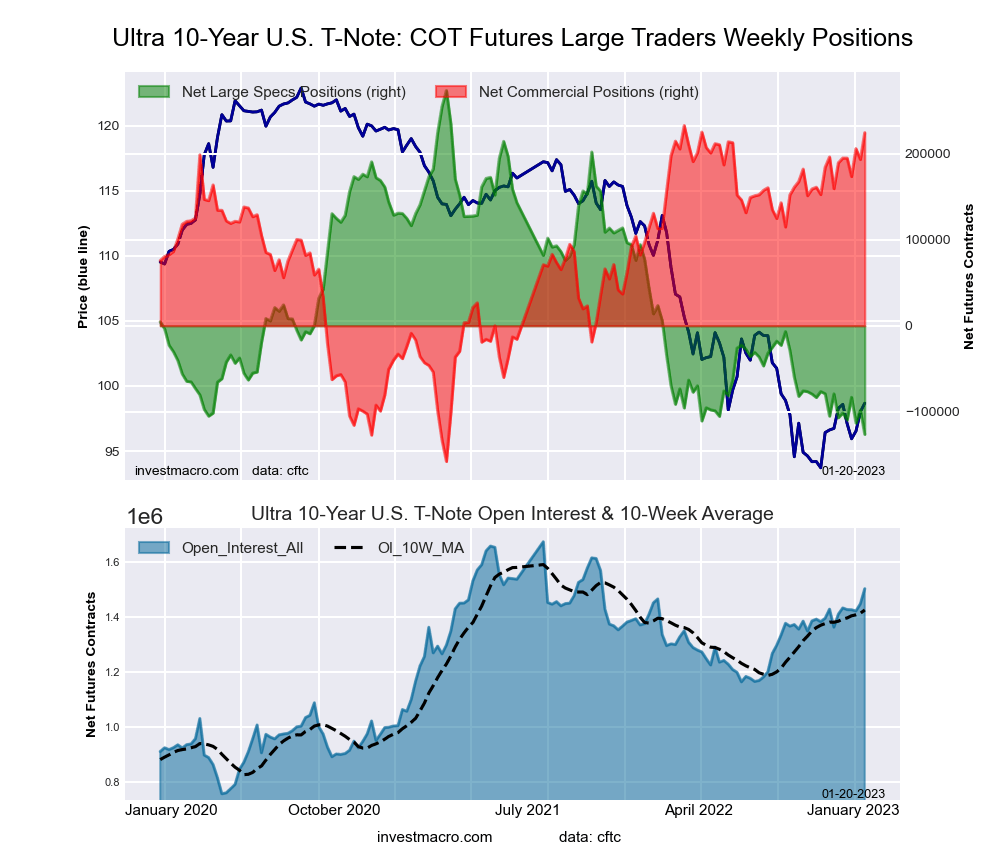
The Ultra 10-Year Notes large speculator standing this week resulted in a net position of -126,321 contracts in the data reported through Tuesday. This was a weekly reduction of -28,051 contracts from the previous week which had a total of -98,270 net contracts.
This week’s current strength score (the trader positioning range over the past three years, measured from 0 to 100) shows the speculators are currently Bearish-Extreme with a score of 0.0 percent. The commercials are Bullish-Extreme with a score of 97.9 percent and the small traders (not shown in chart) are Bullish with a score of 61.8 percent.
| Ultra 10-Year Notes Statistics | SPECULATORS | COMMERCIALS | SMALL TRADERS |
| – Percent of Open Interest Longs: | 10.3 | 78.4 | 10.0 |
| – Percent of Open Interest Shorts: | 18.7 | 63.5 | 16.6 |
| – Net Position: | -126,321 | 224,640 | -98,319 |
| – Gross Longs: | 155,613 | 1,178,847 | 150,997 |
| – Gross Shorts: | 281,934 | 954,207 | 249,316 |
| – Long to Short Ratio: | 0.6 to 1 | 1.2 to 1 | 0.6 to 1 |
| NET POSITION TREND: | |||
| – Strength Index Score (3 Year Range Pct): | 0.0 | 97.9 | 61.8 |
| – Strength Index Reading (3 Year Range): | Bearish-Extreme | Bullish-Extreme | Bullish |
| NET POSITION MOVEMENT INDEX: | |||
| – 6-Week Change in Strength Index: | -4.8 | 9.0 | -10.4 |
US Treasury Bonds Futures:
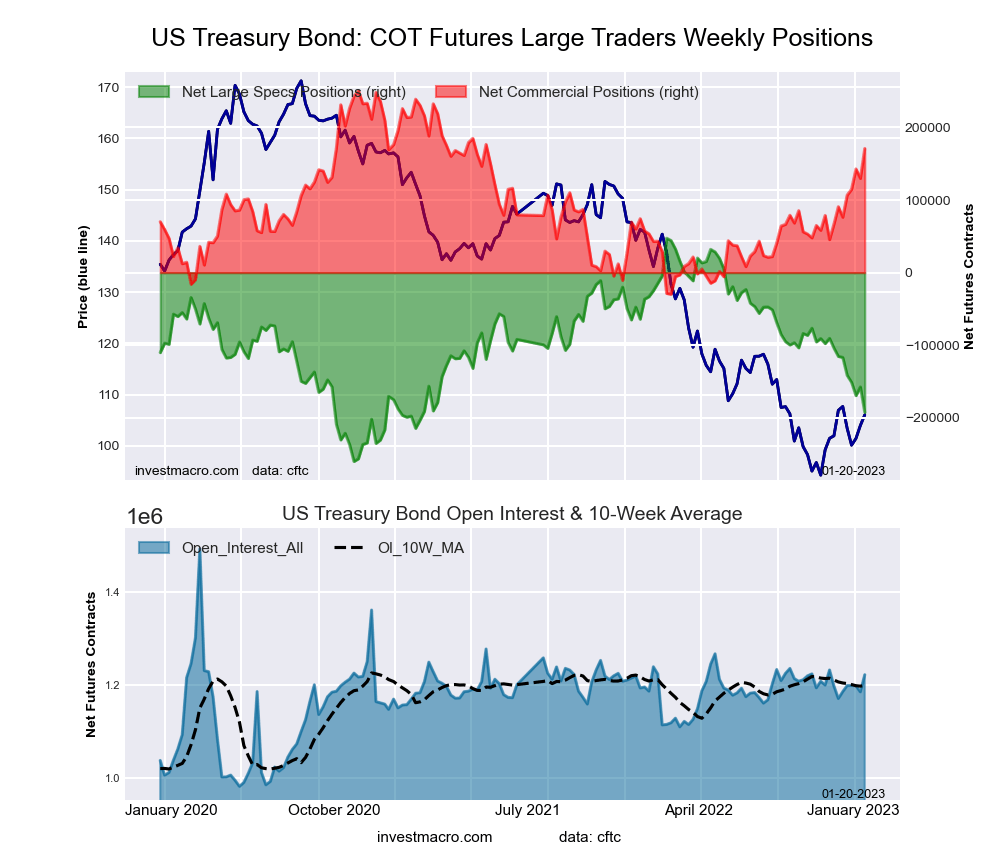
The US Treasury Bonds large speculator standing this week resulted in a net position of -192,393 contracts in the data reported through Tuesday. This was a weekly fall of -35,008 contracts from the previous week which had a total of -157,385 net contracts.
This week’s current strength score (the trader positioning range over the past three years, measured from 0 to 100) shows the speculators are currently Bearish with a score of 22.0 percent. The commercials are Bullish with a score of 71.6 percent and the small traders (not shown in chart) are Bullish with a score of 69.6 percent.
| US Treasury Bonds Statistics | SPECULATORS | COMMERCIALS | SMALL TRADERS |
| – Percent of Open Interest Longs: | 4.2 | 81.3 | 14.0 |
| – Percent of Open Interest Shorts: | 20.0 | 67.4 | 12.3 |
| – Net Position: | -192,393 | 170,932 | 21,461 |
| – Gross Longs: | 51,842 | 994,046 | 171,647 |
| – Gross Shorts: | 244,235 | 823,114 | 150,186 |
| – Long to Short Ratio: | 0.2 to 1 | 1.2 to 1 | 1.1 to 1 |
| NET POSITION TREND: | |||
| – Strength Index Score (3 Year Range Pct): | 22.0 | 71.6 | 69.6 |
| – Strength Index Reading (3 Year Range): | Bearish | Bullish | Bullish |
| NET POSITION MOVEMENT INDEX: | |||
| – 6-Week Change in Strength Index: | -25.1 | 28.6 | -2.5 |
Ultra US Treasury Bonds Futures:
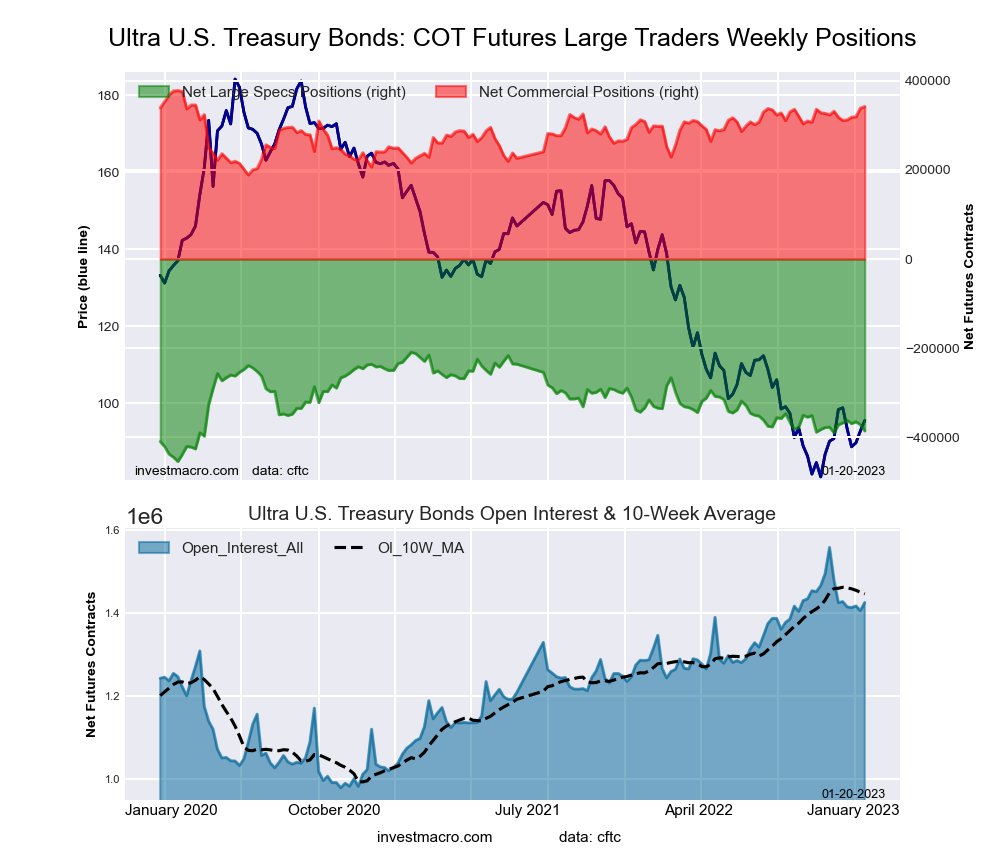
The Ultra US Treasury Bonds large speculator standing this week resulted in a net position of -385,428 contracts in the data reported through Tuesday. This was a weekly reduction of -14,022 contracts from the previous week which had a total of -371,406 net contracts.
This week’s current strength score (the trader positioning range over the past three years, measured from 0 to 100) shows the speculators are currently Bearish with a score of 23.0 percent. The commercials are Bullish-Extreme with a score of 81.9 percent and the small traders (not shown in chart) are Bullish with a score of 67.4 percent.
| Ultra US Treasury Bonds Statistics | SPECULATORS | COMMERCIALS | SMALL TRADERS |
| – Percent of Open Interest Longs: | 4.5 | 83.7 | 11.5 |
| – Percent of Open Interest Shorts: | 31.5 | 59.7 | 8.4 |
| – Net Position: | -385,428 | 342,092 | 43,336 |
| – Gross Longs: | 64,109 | 1,193,027 | 163,472 |
| – Gross Shorts: | 449,537 | 850,935 | 120,136 |
| – Long to Short Ratio: | 0.1 to 1 | 1.4 to 1 | 1.4 to 1 |
| NET POSITION TREND: | |||
| – Strength Index Score (3 Year Range Pct): | 23.0 | 81.9 | 67.4 |
| – Strength Index Reading (3 Year Range): | Bearish | Bullish-Extreme | Bullish |
| NET POSITION MOVEMENT INDEX: | |||
| – 6-Week Change in Strength Index: | -6.0 | 12.9 | -8.6 |
*COT Report: The COT data, released weekly to the public each Friday, is updated through the most recent Tuesday (data is 3 days old) and shows a quick view of how large speculators or non-commercials (for-profit traders) were positioned in the futures markets.
The CFTC categorizes trader positions according to commercial hedgers (traders who use futures contracts for hedging as part of the business), non-commercials (large traders who speculate to realize trading profits) and nonreportable traders (usually small traders/speculators) as well as their open interest (contracts open in the market at time of reporting). See CFTC criteria here.
More By This Author:
Currency Speculators Pull Back On Japanese Yen Bearish Bets To 21-Week Low
Live Cattle Leads Soft Commodities Speculator Bets While Corn & Sugar Bets Fall
COT Bonds Speculators Reduced Their 2-Year & 5-Year Bonds Bearish Bets This Week


Comments
Log in or sign up to join the conversation.