
Live Cattle Leads Soft Commodities Speculator Bets While Corn & Sugar Bets Fall

Image Source: Unsplash
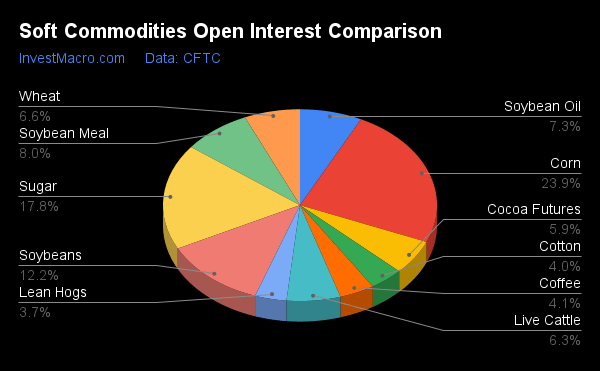
Here are the latest charts and statistics for the Commitment of Traders (COT) reports data published by the Commodities Futures Trading Commission (CFTC). The latest COT data is updated through Tuesday, Jan. 10, and it shows a quick view of how large traders (for-profit speculators and commercial entities) were positioned in the futures markets.
Weekly Speculator Changes Led by Live Cattle & Cotton
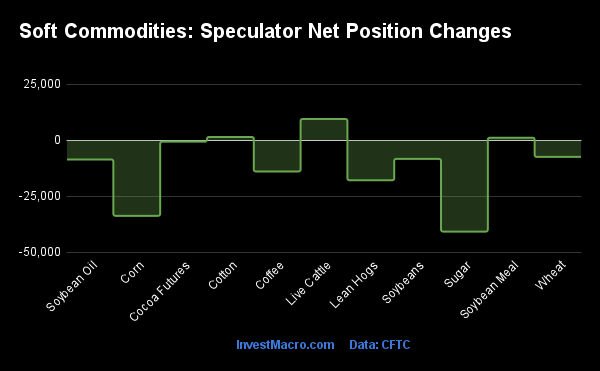
The COT soft commodities markets speculator bets were lower this week, as three out of the eleven soft commodities markets we cover had higher positioning while the other eight markets had lower speculator contracts. Leading the gains for the softs markets was live cattle (9,505 contracts), with cotton (1,485 contracts) and soybean meal (1,142 contracts) also experiencing a positive week.
The commodities that saw declines in speculator bets this week were sugar (-40,779 contracts), corn (-33,737 contracts), coffee (-13,927 contracts), lean hogs (-17,857 contracts), soybean oil (-8,591 contracts), soybeans (-8,311 contracts), wheat (-7,425 contracts), and cocoa (-617 contracts).
Highlighting the COT soft commodities data this week is the continued gain seen in live cattle speculator positioning. The large speculator bets for live cattle increased for a third consecutive week and for the sixth time over the past seven weeks. Speculators bets have now pushed the overall net position standing for live cattle (currently at +79,994 contracts) to the highest level seen in the past forty-six weeks, dating back to Feb. 2 of 2022.
The live cattle futures prices have continued to trade in a sustained uptrend, with prices closing higher in each of the past seven months. Recently, the live cattle futures front month price touched its highest level since 2015, with a high right below the $160 level.
Data Snapshot of Commodity Market Traders | Columns Legend
|
Jan-10-2023
|
OI
|
OI-Index
|
Spec-Net
|
Spec-Index
|
Com-Net
|
COM-Index
|
Smalls-Net
|
Smalls-Index
|
|---|---|---|---|---|---|---|---|---|
| WTI Crude | 1,557,092 | 14 | 205,236 | 0 | -225,502 | 100 | 20,266 | 33 |
| Corn | 1,214,817 | 4 | 233,795 | 60 | -182,611 | 46 | -51,184 | 16 |
| Natural Gas | 1,070,386 | 22 | -172,503 | 27 | 143,506 | 76 | 28,997 | 49 |
| Sugar | 905,839 | 39 | 187,713 | 58 | -232,509 | 36 | 44,796 | 63 |
| Soybeans | 620,659 | 10 | 140,328 | 55 | -104,166 | 57 | -36,162 | 10 |
| Gold | 481,519 | 16 | 150,535 | 33 | -172,478 | 66 | 21,943 | 35 |
| Wheat | 334,538 | 20 | -39,716 | 0 | 43,529 | 100 | -3,813 | 91 |
| Heating Oil | 260,845 | 20 | 16,769 | 67 | -35,035 | 34 | 18,266 | 62 |
| Coffee | 210,169 | 19 | -14,739 | 2 | 11,310 | 96 | 3,429 | 47 |
| Copper | 186,383 | 29 | 10,227 | 44 | -16,253 | 54 | 6,026 | 60 |
| Brent | 140,391 | 4 | -26,209 | 62 | 22,463 | 35 | 3,746 | 60 |
| Silver | 129,961 | 7 | 29,013 | 46 | -42,925 | 55 | 13,912 | 40 |
| Platinum | 72,216 | 43 | 30,702 | 50 | -34,346 | 53 | 3,644 | 17 |
| Palladium | 8,352 | 12 | -2,490 | 11 | 2,337 | 85 | 153 | 51 |
Strength Scores Led by Soybean Meal & Live Cattle
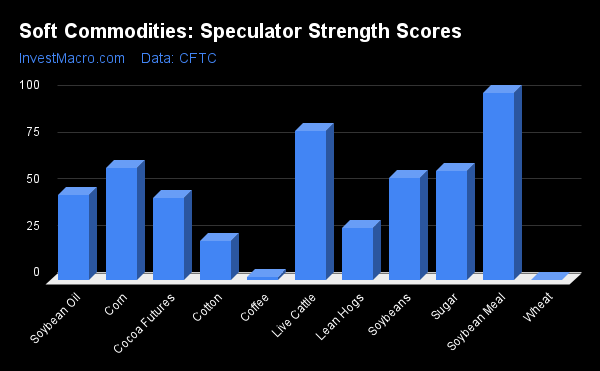
COT strength scores (a normalized measure of speculator positions over a three-year range, from 0 to 100 where above 80 is Extreme-Bullish and below 20 is Extreme-Bearish) showed that soybean meal (100%) and live cattle (80%) led the softs markets this week. Corn (60%), sugar (58%), and soybeans (55%) followed behind as the next highest in terms of their strength scores.
On the downside, wheat (0%) and coffee (2%) served as the commodities with the lowest strength levels, and they are in Extreme-Bearish territory (below 20%). Cotton (21%) and lean hogs (28%) followed behind as the next lowest in terms of their strength scores.
Strength statistics:
- Corn (59.9%) vs. corn the previous week (64.2%).
- Sugar (58.5%) vs. sugar the previous week (72.5%).
- Coffee (1.7%) vs. coffee the previous week (17.7%).
- Soybeans (54.7%) vs. soybeans the previous week (57.3%).
- Soybean oil (45.6%) vs. soybean oil the previous week (51.5%).
- Soybean meal (100.0%) vs. soybean meal the previous week (99.4%).
- Live cattle (79.7%) vs. live cattle the previous week (67.7%).
- Lean hogs (27.7%) vs. lean hogs the previous week (49.3%).
- Cotton (20.9%) vs. cotton the previous week (19.8%).
- Cocoa (43.8%) vs. cocoa the previous week (44.4%).
- Wheat (0.2%) vs. wheat the previous week (7.5%).
Live Cattle & Soybean Meal Top the Six-Week Strength Trends
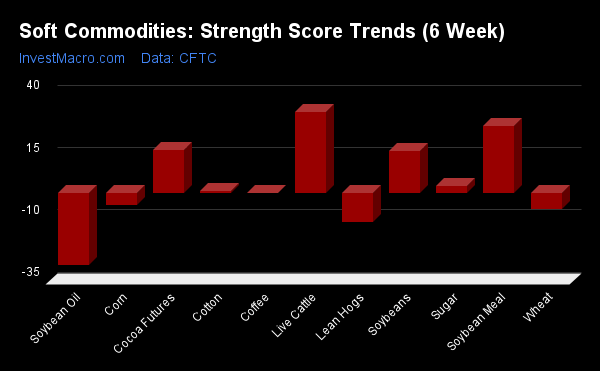
COT strength score trends (or otherwise called the move index, which calculates the six-week changes in strength scores) showed that live cattle (33%) and soybean meal (27%) led the trends for soft commodities over the past six weeks. Soybeans (17%), cocoa (17%), and sugar (3%) followed as the next highest positive movers in terms of the trends data.
Soybean oil (-29%) led the downside trend scores, with lean hogs (-12%), wheat (-6%), and corn (-5%) following behind as the next lowest in terms of trends scores.
Strength trend statistics:
- Corn (-4.7%) vs. corn the previous week (2.4%).
- Sugar (3.0%) vs. sugar the previous week (13.9%).
- Coffee (-0.1%) vs. coffee the previous week (17.7%).
- Soybeans (17.0%) vs. soybeans the previous week (25.1%).
- Soybean oil (-28.7%) vs. soybean oil the previous week (-19.8%).
- Soybean meal (26.8%) vs. soybean meal the previous week (26.8%).
- Live cattle (32.5%) vs. live cattle the previous week (18.8%).
- Lean hogs (-11.8%) vs. lean hogs the previous week (-0.1%).
- Cotton (1.0%) vs. cotton the previous week (-1.0%).
- Cocoa (17.3%) vs. cocoa the previous week (12.4%).
- Wheat (-6.3%) vs. wheat the previous week (-4.7%).
Individual Soft Commodities Markets - Corn Futures
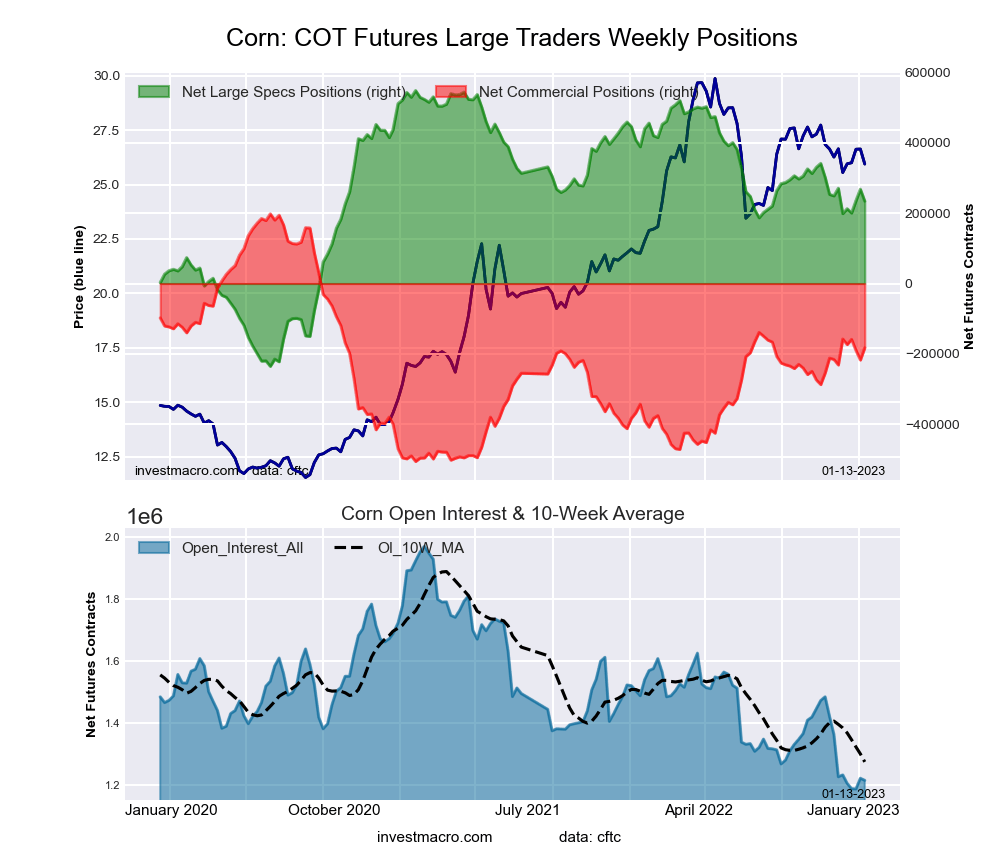
The corn large speculator standing this week resulted in a net position of 233,795 contracts in the data reported through Tuesday. This was a weekly lowering of -33,737 contracts from the previous week, which had a total of 267,532 net contracts.
This week’s current strength score (the trader positioning range over the past three years, measured from 0 to 100) shows the speculators are currently Bullish with a score of 59.9%. The commercials are Bearish with a score of 45.9%, and the small traders (not shown in chart) are Bearish-Extreme with a score of 15.7%.
| CORN Futures Statistics | SPECULATORS | COMMERCIALS | SMALL TRADERS |
| –% of Open Interest Longs: | 27.4 | 46.2 | 9.6 |
| –% of Open Interest Shorts: | 8.2 | 61.2 | 13.8 |
| – Net Position: | 233,795 | -182,611 | -51,184 |
| – Gross Longs: | 332,822 | 561,153 | 116,990 |
| – Gross Shorts: | 99,027 | 743,764 | 168,174 |
| – Long to Short Ratio: | 3.4 to 1 | 0.8 to 1 | 0.7 to 1 |
| NET POSITION TREND: | |||
| – Strength Index Score (3 Year Range Pct): | 59.9 | 45.9 | 15.7 |
| – Strength Index Reading (3 Year Range): | Bullish | Bearish | Bearish-Extreme |
| NET POSITION MOVEMENT INDEX: | |||
| – 6-Week Change in Strength Index: | -4.7 | 6.9 | -8.0 |
Sugar Futures
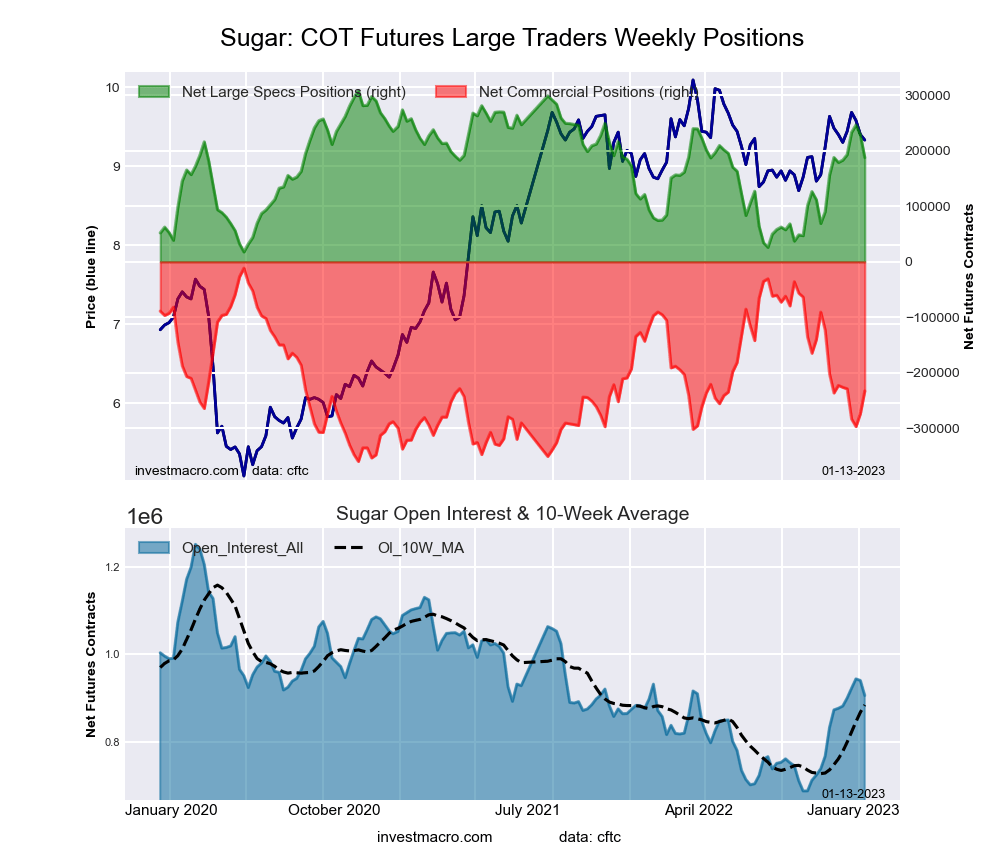
The sugar large speculator standing this week resulted in a net position of 187,713 contracts in the data reported through Tuesday. This was a weekly decline of -40,779 contracts from the previous week, which had a total of 228,492 net contracts.
This week’s current strength score (the trader positioning range over the past three years, measured from 0 to 100) shows the speculators are currently Bullish with a score of 58.5%. The commercials are Bearish with a score of 36.5%, and the small traders (not shown in chart) are Bullish with a score of 63.2%.
| SUGAR Futures Statistics | SPECULATORS | COMMERCIALS | SMALL TRADERS |
| –% of Open Interest Longs: | 30.3 | 44.1 | 9.9 |
| –% of Open Interest Shorts: | 9.6 | 69.8 | 5.0 |
| – Net Position: | 187,713 | -232,509 | 44,796 |
| – Gross Longs: | 274,296 | 399,818 | 90,034 |
| – Gross Shorts: | 86,583 | 632,327 | 45,238 |
| – Long to Short Ratio: | 3.2 to 1 | 0.6 to 1 | 2.0 to 1 |
| NET POSITION TREND: | |||
| – Strength Index Score (3 Year Range Pct): | 58.5 | 36.5 | 63.2 |
| – Strength Index Reading (3 Year Range): | Bullish | Bearish | Bullish |
| NET POSITION MOVEMENT INDEX: | |||
| – 6-Week Change in Strength Index: | 3.0 | -2.8 | 1.5 |
Coffee Futures
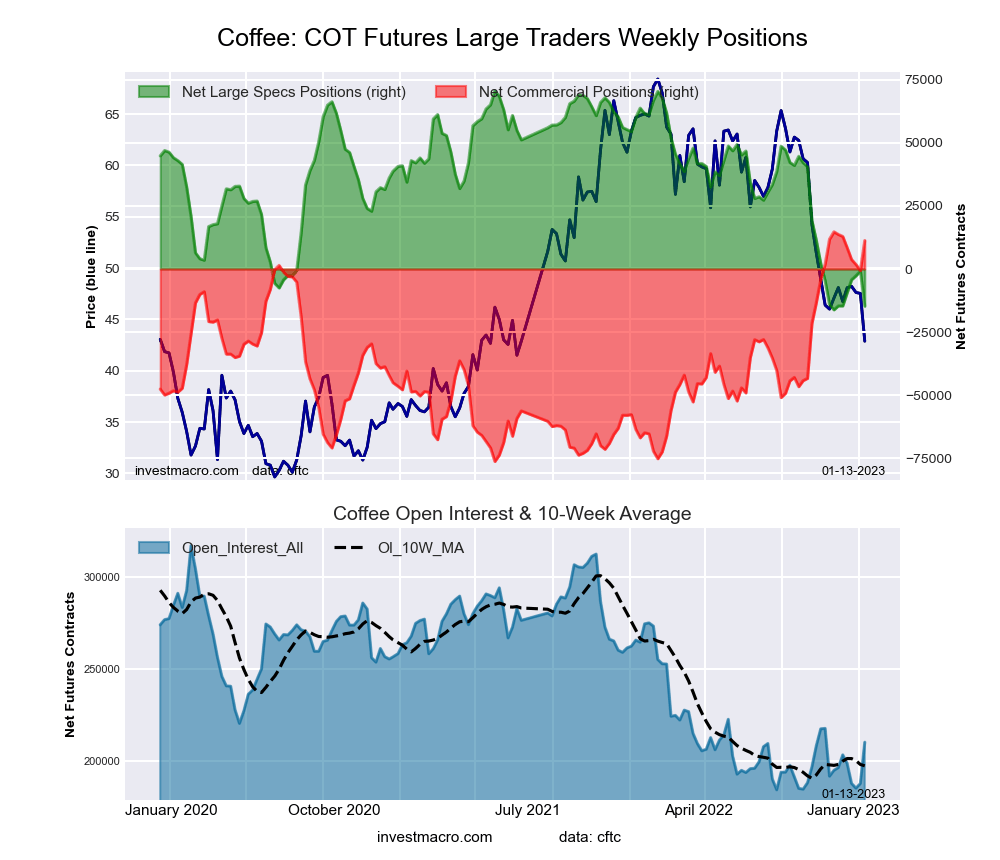
The coffee large speculator standing this week resulted in a net position of -14,739 contracts in the data reported through Tuesday. This was a weekly reduction of -13,927 contracts from the previous week, which had a total of -812 net contracts.
This week’s current strength score (the trader positioning range over the past three years, measured from 0 to 100) shows the speculators are currently Bearish-Extreme with a score of 1.7%. The commercials are Bullish-Extreme with a score of 96.2%, and the small traders (not shown in chart) are Bearish with a score of 47.2%.
| COFFEE Futures Statistics | SPECULATORS | COMMERCIALS | SMALL TRADERS |
| –% of Open Interest Longs: | 23.2 | 51.8 | 5.5 |
| –% of Open Interest Shorts: | 30.2 | 46.4 | 3.9 |
| – Net Position: | -14,739 | 11,310 | 3,429 |
| – Gross Longs: | 48,809 | 108,900 | 11,598 |
| – Gross Shorts: | 63,548 | 97,590 | 8,169 |
| – Long to Short Ratio: | 0.8 to 1 | 1.1 to 1 | 1.4 to 1 |
| NET POSITION TREND: | |||
| – Strength Index Score (3 Year Range Pct): | 1.7 | 96.2 | 47.2 |
| – Strength Index Reading (3 Year Range): | Bearish-Extreme | Bullish-Extreme | Bearish |
| NET POSITION MOVEMENT INDEX: | |||
| – 6-Week Change in Strength Index: | -0.1 | -2.6 | 34.7 |
Soybeans Futures
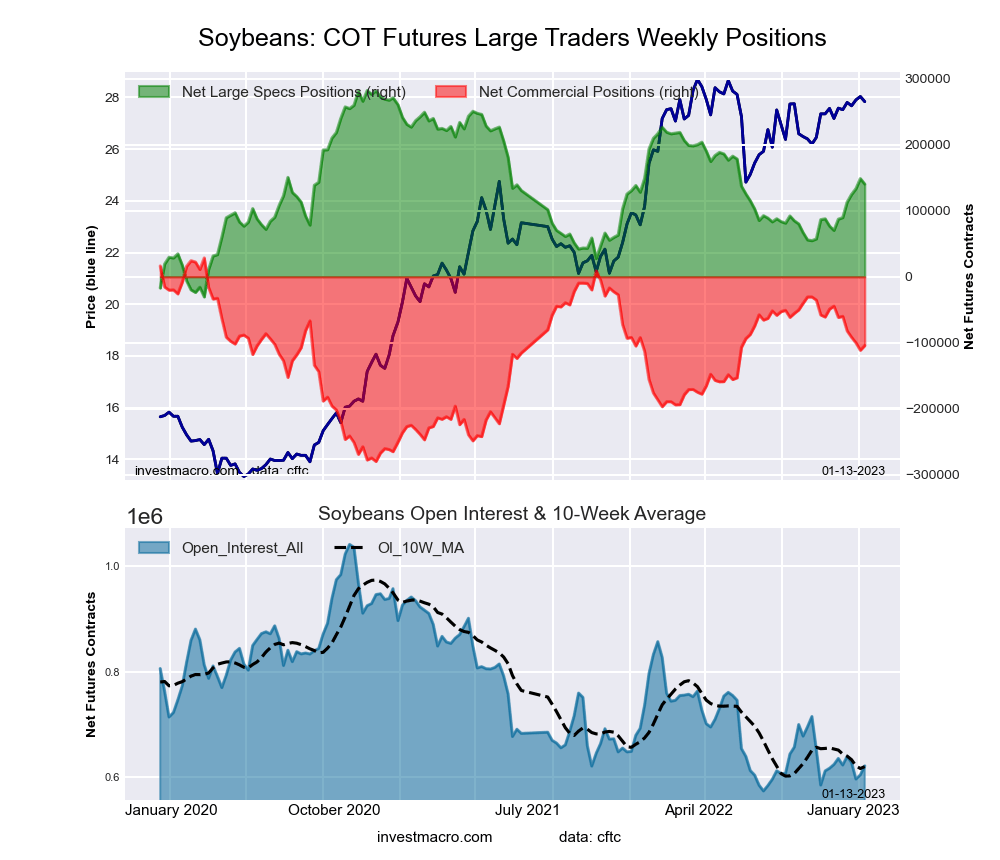
The soybeans large speculator standing this week resulted in a net position of 140,328 contracts in the data reported through Tuesday. This was a weekly reduction of -8,311 contracts from the previous week, which had a total of 148,639 net contracts.
This week’s current strength score (the trader positioning range over the past three years, measured from 0 to 100) shows the speculators are currently Bullish with a score of 54.7%. The commercials are Bullish with a score of 57.0%, and the small traders (not shown in chart) are Bearish-Extreme with a score of 9.9%.
| SOYBEANS Futures Statistics | SPECULATORS | COMMERCIALS | SMALL TRADERS |
| –% of Open Interest Longs: | 30.3 | 48.7 | 6.9 |
| –% of Open Interest Shorts: | 7.7 | 65.5 | 12.8 |
| – Net Position: | 140,328 | -104,166 | -36,162 |
| – Gross Longs: | 187,837 | 302,217 | 42,977 |
| – Gross Shorts: | 47,509 | 406,383 | 79,139 |
| – Long to Short Ratio: | 4.0 to 1 | 0.7 to 1 | 0.5 to 1 |
| NET POSITION TREND: | |||
| – Strength Index Score (3 Year Range Pct): | 54.7 | 57.0 | 9.9 |
| – Strength Index Reading (3 Year Range): | Bullish | Bullish | Bearish-Extreme |
| NET POSITION MOVEMENT INDEX: | |||
| – 6-Week Change in Strength Index: | 17.0 | -13.8 | -17.8 |
Soybean Oil Futures
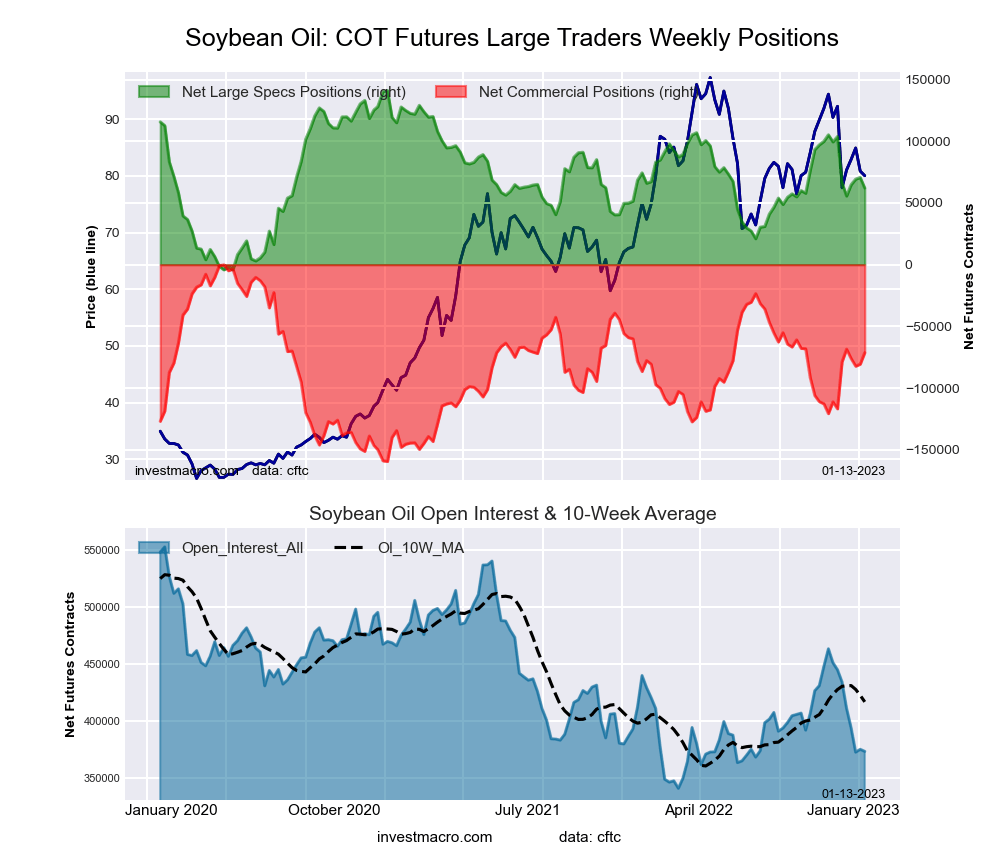
The soybean oil large speculator standing this week resulted in a net position of 62,099 contracts in the data reported through Tuesday. This was a weekly decrease of -8,591 contracts from the previous week, which had a total of 70,690 net contracts.
This week’s current strength score (the trader positioning range over the past three years, measured from 0 to 100) shows the speculators are currently Bearish with a score of 45.6%. The commercials are Bullish with a score of 55.3%, and the small traders (not shown in chart) are Bearish with a score of 48.0%.
| SOYBEAN OIL Futures Statistics | SPECULATORS | COMMERCIALS | SMALL TRADERS |
| –% of Open Interest Longs: | 24.5 | 49.1 | 8.9 |
| –% of Open Interest Shorts: | 7.8 | 68.2 | 6.4 |
| – Net Position: | 62,099 | -71,356 | 9,257 |
| – Gross Longs: | 91,252 | 183,263 | 33,103 |
| – Gross Shorts: | 29,153 | 254,619 | 23,846 |
| – Long to Short Ratio: | 3.1 to 1 | 0.7 to 1 | 1.4 to 1 |
| NET POSITION TREND: | |||
| – Strength Index Score (3 Year Range Pct): | 45.6 | 55.3 | 48.0 |
| – Strength Index Reading (3 Year Range): | Bearish | Bullish | Bearish |
| NET POSITION MOVEMENT INDEX: | |||
| – 6-Week Change in Strength Index: | -28.7 | 28.6 | -14.1 |
Soybean Meal Futures
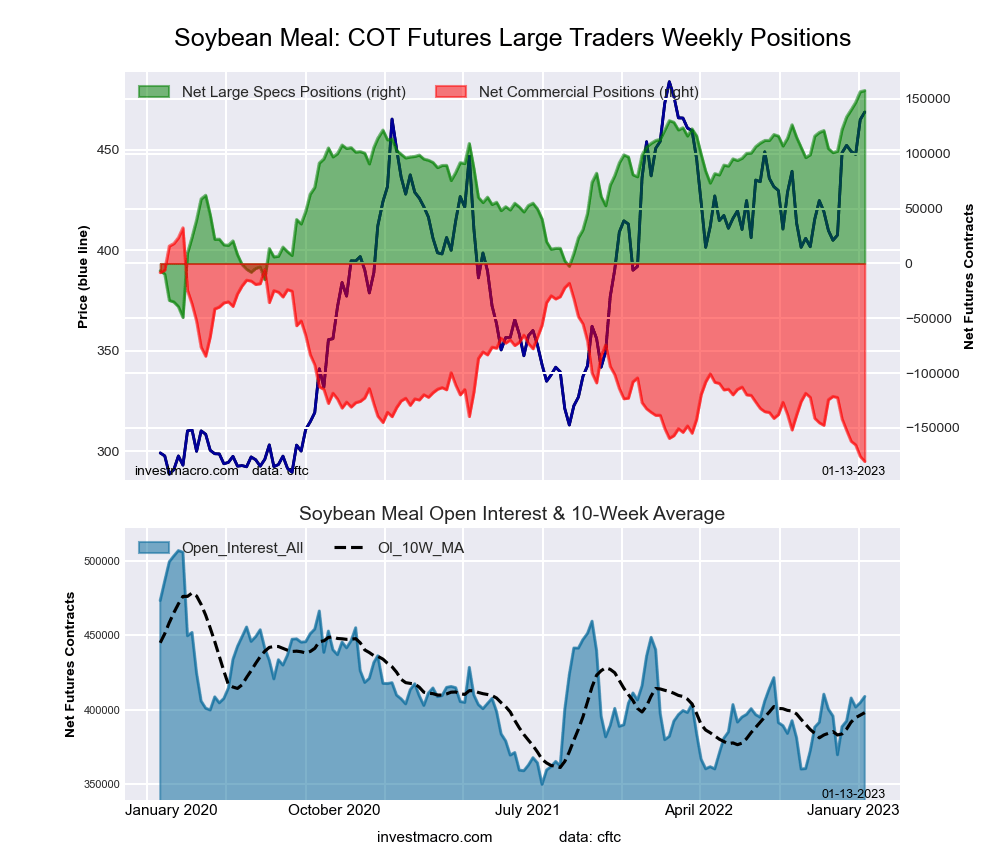
The soybean meal large speculator standing this week resulted in a net position of 157,710 contracts in the data reported through Tuesday. This was a weekly boost of 1,142 contracts from the previous week, which had a total of 156,568 net contracts.
This week’s current strength score (the trader positioning range over the past three years, measured from 0 to 100) shows the speculators are currently Bullish-Extreme with a score of 100.0%. The commercials are Bearish-Extreme with a score of 0.0%, and the small traders (not shown in chart) are Bullish with a score of 51.4%.
| SOYBEAN MEAL Futures Statistics | SPECULATORS | COMMERCIALS | SMALL TRADERS |
| –% of Open Interest Longs: | 42.0 | 31.9 | 11.9 |
| –% of Open Interest Shorts: | 3.4 | 76.0 | 6.3 |
| – Net Position: | 157,710 | -180,580 | 22,870 |
| – Gross Longs: | 171,785 | 130,280 | 48,473 |
| – Gross Shorts: | 14,075 | 310,860 | 25,603 |
| – Long to Short Ratio: | 12.2 to 1 | 0.4 to 1 | 1.9 to 1 |
| NET POSITION TREND: | |||
| – Strength Index Score (3 Year Range Pct): | 100.0 | 0.0 | 51.4 |
| – Strength Index Reading (3 Year Range): | Bullish-Extreme | Bearish-Extreme | Bullish |
| NET POSITION MOVEMENT INDEX: | |||
| – 6-Week Change in Strength Index: | 26.8 | -27.4 | 15.3 |
Live Cattle Futures
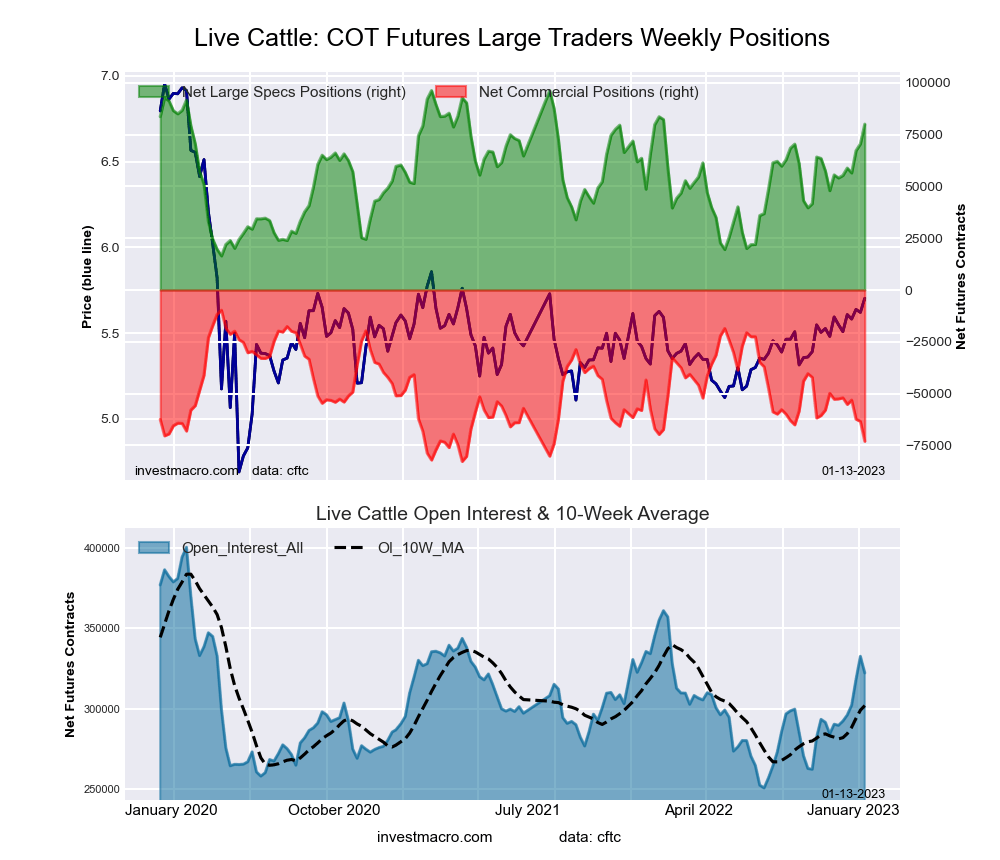
The live cattle large speculator standing this week resulted in a net position of 79,994 contracts in the data reported through Tuesday. This was a weekly advance of 9,505 contracts from the previous week, which had a total of 70,489 net contracts.
This week’s current strength score (the trader positioning range over the past three years, measured from 0 to 100) shows the speculators are currently Bullish with a score of 79.7%. The commercials are Bearish-Extreme with a score of 13.3%, and the small traders (not shown in chart) are Bullish with a score of 64.9%.
| LIVE CATTLE Futures Statistics | SPECULATORS | COMMERCIALS | SMALL TRADERS |
| –% of Open Interest Longs: | 41.0 | 27.5 | 10.5 |
| –% of Open Interest Shorts: | 16.1 | 50.1 | 12.7 |
| – Net Position: | 79,994 | -72,962 | -7,032 |
| – Gross Longs: | 132,029 | 88,511 | 33,907 |
| – Gross Shorts: | 52,035 | 161,473 | 40,939 |
| – Long to Short Ratio: | 2.5 to 1 | 0.5 to 1 | 0.8 to 1 |
| NET POSITION TREND: | |||
| – Strength Index Score (3 Year Range Pct): | 79.7 | 13.3 | 64.9 |
| – Strength Index Reading (3 Year Range): | Bullish | Bearish-Extreme | Bullish |
| NET POSITION MOVEMENT INDEX: | |||
| – 6-Week Change in Strength Index: | 32.5 | -28.0 | -21.6 |
Lean Hogs Futures
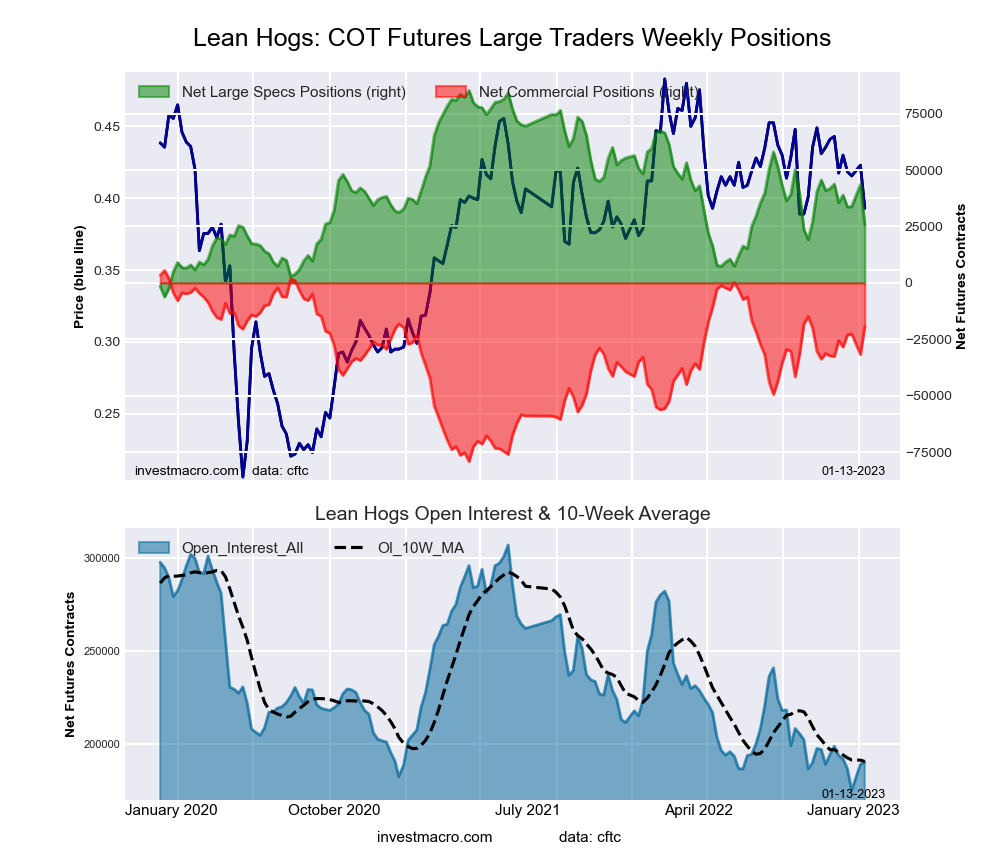
The lean hogs large speculator standing this week resulted in a net position of 25,769 contracts in the data reported through Tuesday. This was a weekly fall of -17,857 contracts from the previous week, which had a total of 43,626 net contracts.
This week’s current strength score (the trader positioning range over the past three years, measured from 0 to 100) shows the speculators are currently Bearish with a score of 27.7%. The commercials are Bullish with a score of 73.8%, and the small traders (not shown in chart) are Bullish with a score of 72.1%.
| LEAN HOGS Futures Statistics | SPECULATORS | COMMERCIALS | SMALL TRADERS |
| –% of Open Interest Longs: | 34.3 | 36.9 | 10.0 |
| –% of Open Interest Shorts: | 20.7 | 47.1 | 13.3 |
| – Net Position: | 25,769 | -19,358 | -6,411 |
| – Gross Longs: | 65,146 | 70,042 | 18,949 |
| – Gross Shorts: | 39,377 | 89,400 | 25,360 |
| – Long to Short Ratio: | 1.7 to 1 | 0.8 to 1 | 0.7 to 1 |
| NET POSITION TREND: | |||
| – Strength Index Score (3 Year Range Pct): | 27.7 | 73.8 | 72.1 |
| – Strength Index Reading (3 Year Range): | Bearish | Bullish | Bullish |
| NET POSITION MOVEMENT INDEX: | |||
| – 6-Week Change in Strength Index: | -11.8 | 7.6 | 21.4 |
Cotton Futures

The cotton large speculator standing this week resulted in a net position of 17,944 contracts in the data reported through Tuesday. This was a weekly increase of 1,485 contracts from the previous week, which had a total of 16,459 net contracts.
This week’s current strength score (the trader positioning range over the past three years, measured from 0 to 100) shows the speculators are currently Bearish with a score of 20.9%. The commercials are Bullish with a score of 79.0%, and the small traders (not shown in chart) are Bearish with a score of 23.2%.
| COTTON Futures Statistics | SPECULATORS | COMMERCIALS | SMALL TRADERS |
| –% of Open Interest Longs: | 28.8 | 49.6 | 6.7 |
| –% of Open Interest Shorts: | 19.9 | 59.5 | 5.7 |
| – Net Position: | 17,944 | -19,936 | 1,992 |
| – Gross Longs: | 58,104 | 99,886 | 13,474 |
| – Gross Shorts: | 40,160 | 119,822 | 11,482 |
| – Long to Short Ratio: | 1.4 to 1 | 0.8 to 1 | 1.2 to 1 |
| NET POSITION TREND: | |||
| – Strength Index Score (3 Year Range Pct): | 20.9 | 79.0 | 23.2 |
| – Strength Index Reading (3 Year Range): | Bearish | Bullish | Bearish |
| NET POSITION MOVEMENT INDEX: | |||
| – 6-Week Change in Strength Index: | 1.0 | -1.2 | 2.6 |
Cocoa Futures
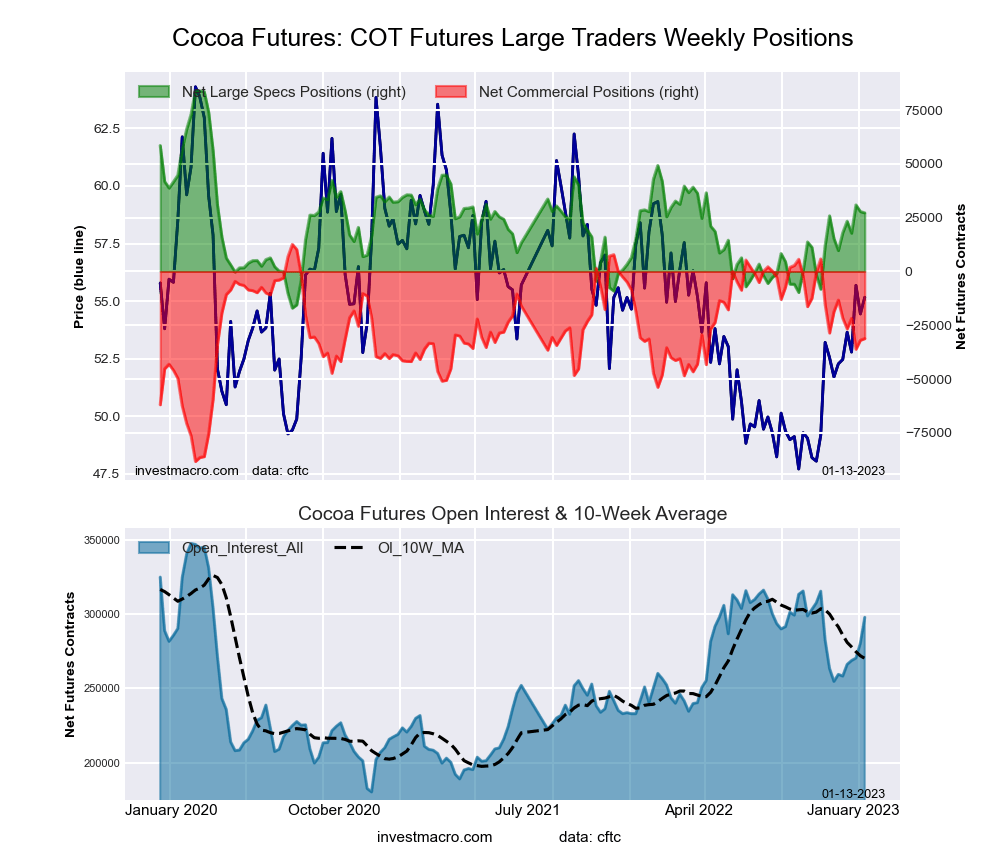
The cocoa large speculator standing this week resulted in a net position of 27,221 contracts in the data reported through Tuesday. This was a weekly decrease of -617 contracts from the previous week, which had a total of 27,838 net contracts.
This week’s current strength score (the trader positioning range over the past three years, measured from 0 to 100) shows the speculators are currently Bearish with a score of 43.8%. The commercials are Bullish with a score of 56.6%, and the small traders (not shown in chart) are Bearish with a score of 36.3%.
| COCOA Futures Statistics | SPECULATORS | COMMERCIALS | SMALL TRADERS |
| –% of Open Interest Longs: | 31.6 | 44.4 | 4.6 |
| –% of Open Interest Shorts: | 22.5 | 54.9 | 3.2 |
| – Net Position: | 27,221 | -31,199 | 3,978 |
| – Gross Longs: | 94,218 | 132,109 | 13,616 |
| – Gross Shorts: | 66,997 | 163,308 | 9,638 |
| – Long to Short Ratio: | 1.4 to 1 | 0.8 to 1 | 1.4 to 1 |
| NET POSITION TREND: | |||
| – Strength Index Score (3 Year Range Pct): | 43.8 | 56.6 | 36.3 |
| – Strength Index Reading (3 Year Range): | Bearish | Bullish | Bearish |
| NET POSITION MOVEMENT INDEX: | |||
| – 6-Week Change in Strength Index: | 17.3 | -17.7 | 3.6 |
Wheat Futures
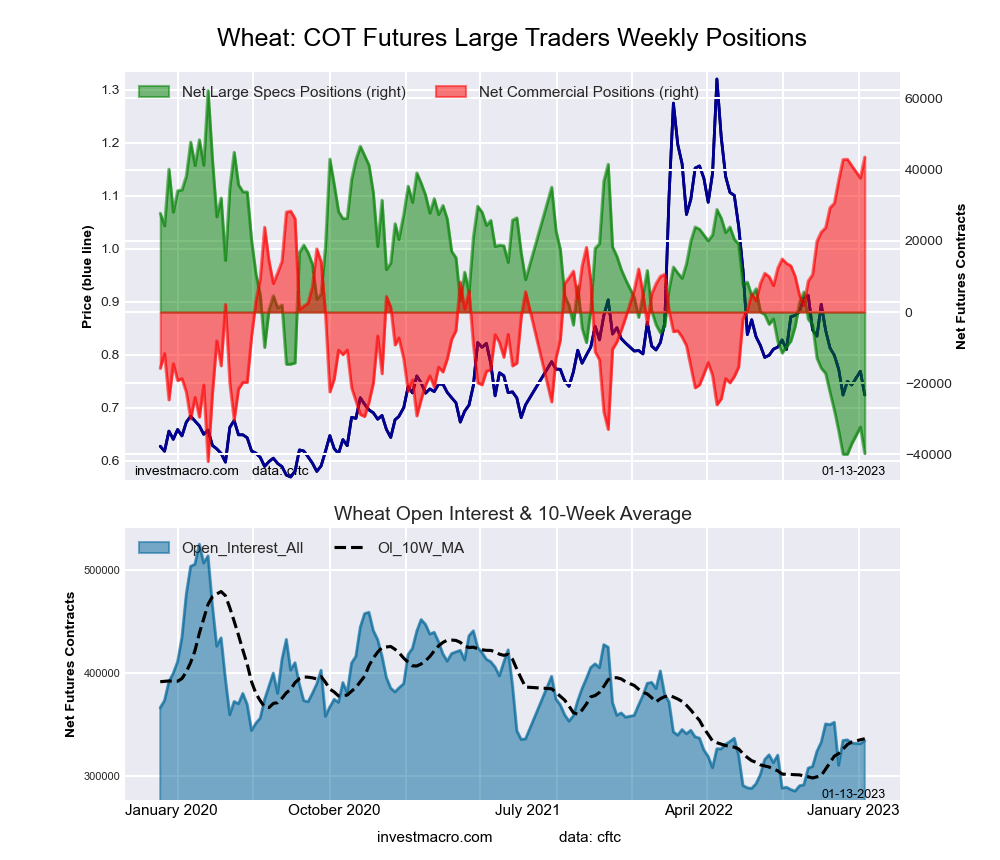
The wheat large speculator standing this week resulted in a net position of -39,716 contracts in the data reported through Tuesday. This was a weekly lowering of -7,425 contracts from the previous week, which had a total of -32,291 net contracts.
This week’s current strength score (the trader positioning range over the past three years, measured from 0 to 100) shows the speculators are currently Bearish-Extreme with a score of 0.2%. The commercials are Bullish-Extreme with a score of 100.0%, and the small traders (not shown in chart) are Bullish-Extreme with a score of 90.6%.
| WHEAT Futures Statistics | SPECULATORS | COMMERCIALS | SMALL TRADERS |
| –% of Open Interest Longs: | 26.0 | 42.1 | 10.0 |
| –% of Open Interest Shorts: | 37.9 | 29.1 | 11.2 |
| – Net Position: | -39,716 | 43,529 | -3,813 |
| – Gross Longs: | 87,085 | 140,763 | 33,599 |
| – Gross Shorts: | 126,801 | 97,234 | 37,412 |
| – Long to Short Ratio: | 0.7 to 1 | 1.4 to 1 | 0.9 to 1 |
| NET POSITION TREND: | |||
| – Strength Index Score (3 Year Range Pct): | 0.2 | 100.0 | 90.6 |
| – Strength Index Reading (3 Year Range): | Bearish-Extreme | Bullish-Extreme | Bullish-Extreme |
| NET POSITION MOVEMENT INDEX: | |||
| – 6-Week Change in Strength Index: | -6.3 | 7.6 | -0.5 |
Article By InvestMacro – Receive our weekly COT Newsletter
*COT Report: The COT data, released weekly to the public each Friday, is updated through the most recent Tuesday (data is three days old) and shows a quick view of how large speculators or non-commercials (for-profit traders) were positioned in the futures markets.
The CFTC categorizes trader positions according to commercial hedgers (traders who use futures contracts for hedging as part of the business), non-commercials (large traders who speculate to realize trading profits), and non-reportable traders (usually small traders/speculators), as well as their open interest (contracts open in the market at time of reporting). See CFTC criteria here.
More By This Author:
Speculator Extremes: Soybean Meal & Ultra 10-Year Bonds Lead Weekly Bullish & Bearish Positions
Large Currency Speculators Trimmed Euro Bullish Bets
Metals Speculators Push Their Platinum Bullish Bets To 91-Week High
Disclosure: Foreign Currency trading and trading on margin carries a high level of risk and can result in loss of part or all of your investment.Due to the level of risk and market volatility, ...
more

