

Image Source: Pexels
In this brief market report, we will take a look at the various asset classes, sectors, equity categories, ETFs, and stocks that moved the market higher, as well as the market segments that defied the trend by moving lower. The idea is to discern newly emerging market leadership.
Identifying these pockets of strength and weakness can often allow us to see the direction of significant money flows, along with their origin.
The Nine-Day Winning Streak has Ended
After a rare nine-day winning streak, the S&P 500 tread water last week and finished down slightly.

Image Source: ZenInvestor.org
A Look at Monthly Returns
This next chart shows the monthly returns for the past year. May has been off to a good start as investors were cheered by the trade deal framework with the UK and signs of thawing in the frigid relationship between the US and China.
So far this year, only January has been an up month. This May, we may get another winning month, but it's far from certain at this early point.

Image Source: ZenInvestor.org
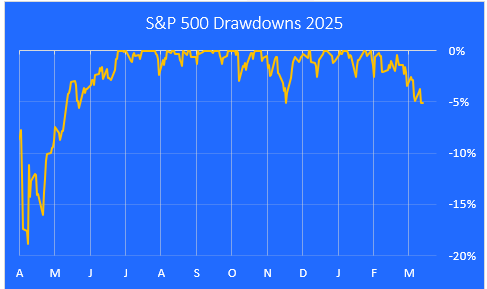
A Look at Drawdowns This Year
Here is a closer look at the pullbacks we've seen over the last 12 months, using a drawdown chart. The current drawdown is -8% from the Feb. 19 high. As you can see, most of the damage over the last 12 months has happened since the start of this year.

Image Source: ZenInvestor.org
A Look at the Bull Run Since it Began Last October
This next chart highlights the 53.2% gain in the S&P 500 from the October 2022 low through last Friday's close. It looks to be well below the trendline, and it seems like there may be further to go on the downside before the correction is over.

Image Source: ZenInvestor.org
Major Asset Class Performance
I'm trying out a new set of charts this week, and if you have an opinion, leave a comment below.
Here is a look at the performance of the major asset classes, sorted by year-to-date returns. The best performer so far is Non-US equities. The worst performer is US equities.

Image Source: ZenInvestor.org
Major Indices Performance
2025 is shaping up to be the year of non-US markets, both developed and emerging. Everything else is down for the year, especially US small-caps.

Image Source: ZenInvestor.org
Non-US Market Returns
The following chart shows how dominant non-US markets have been so far this year. Germany leads the developed markets, while India is down but less so than the US.

Image Source: ZenInvestor.org
Equity Sector Performance
On a year-to-date basis, Utilities are leading the way higher, based on heavy demand from server farms running AI models. Consumer Discretionary looks to be the worst-performing sector. Is consumer spending going to start shrinking too?

Image Source: ZenInvestor.org
Equity Factor Performance
This chart shows the year-to-date performance of equity groups that share similar characteristics, like quality, value, low volatility, and so on. We can see that companies with steadily growing dividends (yield) have been the best performers, while the small-caps have been getting hammered.

Image Source: ZenInvestor.org
Growth vs. Value
In the following chart we can see the repeating pattern of non-US stocks outperforming US stocks, and how small-caps have been struggling to keep up. Overall, value stocks have outperformed growth stocks on a year-to-date basis. This may be because investors and consumers are dealing with high anxiety over tariffs and how much they could cost them in the near future.

Image Source: ZenInvestor.org
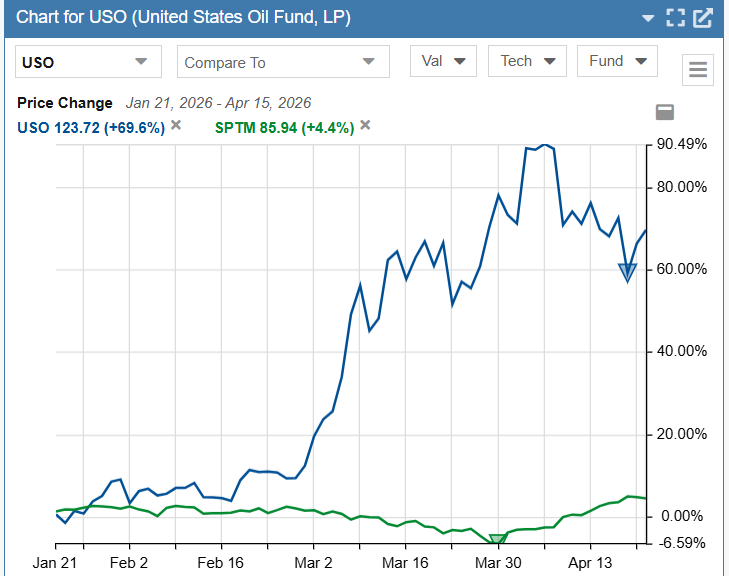
Commodities
Gold and silver are the places to be, if you invest in commodities. Oil and natural gas have seen some heavy selling.

Image Source: ZenInvestor.org
The S&P 500's Mag 7
Here is a closer look at the Magnificent 7. These seven stocks are still down on a year-to-date basis. Faith in the AI trade is being tested.
The big winner this week was Tesla (TSLA), despite the damage done to the brand and Elon Musk's reputation. Tesla, Apple, and Google are all in there own bear markets, it seems.

Image Source: ZenInvestor.org
The Mag 7's Dominance is a Drag On Performance This Year
After leading the market higher over the last two years, the Magnificent 7 are now a drag on the S&P 500 index on a year-to-date basis. The other 493 stocks in the S&P 500 are up an average of 0.9% year-to-date.
Investors are cutting back on the Magnificent 7 stocks and looking for other potential AI winners that are trading at much better prices.

Image Source: ZenInvestor.org
The 10 Best-Performing ETFs from Last Week
The big winners this week were Solar Energy (TAN), Gold Miners (GDX), and 3D Printing (PRNT). Bitcoin made it back above $100,000 after a sharp correction over the past couple of months.

Image Source: ZenInvestor.org
The 10 Worst-Performing ETFs from Last Week
After making the top 10 list for two weeks in a row, Cannabis (MSOS) is back on the loser list, down 13% over the past week alone. Biotech also got hit hard, probably due to fears that China will impose heavy tariffs on the drugs they sell to America.

Image Source: ZenInvestor.org
Momentum Stocks
Hertz (HTZ) has rocketed higher this year, but it started from a very low base. Investors want bargains right now, so Hertz was a good value play. Compass Minerals (CMP) produces salt and potash.

Image Source: ZenInvestor.org
Final Thoughts
Notwithstanding the nine-day 10% rally in the S&P 500 index, we are still stuck in a correction. I expect another leg down or two in the weeks ahead, and perhaps a test of the recent low of 4982. I think that level will hold, though, and a bear market will be avoided. If trade negotiations go poorly, we could slip into a tariff-driven recession, which would change my outlook from being cautiously bullish to outright bearish.
To recap the 2025 year-to-date action, investors have been doing the following:
- Selling US stocks and buying non-US stocks
- Selling energy stocks and buying gold & silver
- Selling semiconductors and buying utilities
- Selling growth stocks and buying value stocks
- Selling cyclical stocks and buying defensive names
- Selling the Magnificent 7 stocks (down 12% year-to-date) after two years of heavy buying
More By This Author:
The One-Minute Market Report - Saturday, April 26
The One-Minute Market Report - Saturday, April 19
The One-Minute Market Report - Saturday, March 15

Comments
Log in or sign up to join the conversation.