

Image Source: Pixabay
In this brief market report, we will take a look at the various asset classes, sectors, equity categories, ETFs, and stocks that moved the market higher, as well as the market segments that defied the trend by moving lower. The idea is to discern newly emerging market leadership.
Identifying these pockets of strength and weakness can often allow us to see the direction of significant money flows, along with their origin.
A Four-Day Winning Streak
In yet another bout of headline-driven volatility, the S%P 500 reacted to Trump's softened stand vs. China by taking off on a four-day run that ended with a 4.6% gain for the week.

Image Source: ZenInvestor.org
The Death Cross
A death cross occurs when the 50-day moving average drops below the 200-day moving average. Market technicians often view this as a significant signal, as it can confirm the downside momentum on a long-term basis. It's not very useful as a market timing tool, however, because much of the damage has already been done by the time this signal is triggered.
What it does show is that the recent sell-off is likely to continue for an extended period of time. The good news is that the last time we witnessed a death cross formation was in January 2023, just as the market was about to deliver back-to-back annual gains of +20%.

Image Source: ZenInvestor.org
A Look at Monthly Returns
This next chart shows the monthly returns for the past year. Until last week, April was on track to be the worst month out of the past 12. Now, with the recent rebound, it's possible that April will end up in positive territory.

Image Source: ZenInvestor.org
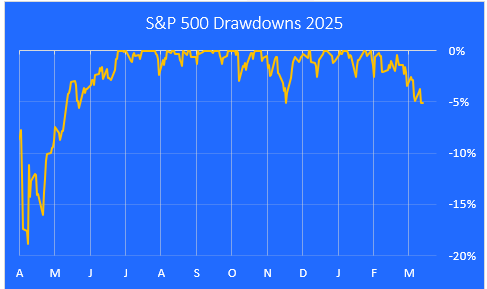
A Look at Drawdowns This Year
Here is a closer look at the pullbacks we've had over the last 12 months, using a drawdown chart. The current drawdown is -10% from the Feb. 19 high.

Image Source: ZenInvestor.org
A Look at the Bull Run Since it Began Last October
The following chart highlights the 49.5% gain in the S&P 500 from the October 2022 low through last Friday's close. It looks to be well below the trendline, and it seems like there may be further to go on the downside before the correction is over.

Image Source: ZenInvestor.org
Major Asset Class Performance
Here is a look at the performance of the major asset classes, sorted by last week's returns. I also included the returns since the Oct. 12, 2022 low for additional context.
The best performer last week was Blockchain, as Bitcoin bounced off of its recent low. The worst performer was Volatility, as measured by the VIX index.

Image Source: ZenInvestor.org
Equity Sector Performance
Tech stocks, especially large-cap tech, rallied to lead the market higher last week. The softened stance vs. China could mean that chips and chip equipment may get carved out of the tariff plan.
Additionally, Healthcare had a good week as investors scooped up some bargains in the sector. On a year-to-date basis, Utilities is the only sector showing positive momentum. Consumer Discretionary is the worst-performing sector.

Image Source: ZenInvestor.org

Image Source: ZenInvestor.org
Equity Group Performance
For the groups, I separate the stocks in the S&P 1500 Composite Index by shared characteristics like growth, value, size, cyclical, defensive, and domestic vs. foreign.
The best-performing equity groups were the Magnificent 7 and large-cap stocks. Investors rotated out of defensive names and into cyclicals. Growth stocks outperformed value stocks.

Image Source: ZenInvestor.org
The S&P 500 Mag 7
Here is a closer look at the Magnificent 7. These stocks had a great week, but they are still down on a year-to-date basis. Faith in the AI trade is seemingly being tested.
The big winner this week was Tesla (TSLA), which has suffered serious damage to the brand and Elon Musk's reputation. Tesla remains in a bear market.

Image Source: ZenInvestor.org
The Mag 7's Dominance is a Drag on Performance
After leading the market higher for the last two years, the Magnificent 7 stocks are now a drag on the S&P 500 index on a year-to-date basis. The other 493 stocks in the S&P 500 are only down an average of 0.9% year-to-date.

Image Source: ZenInvestor.org
The 10 Best-Performing ETFs from Last Week
The big winners this week include Global Internet, Bitcoin, and Fintech. Cannabis has made the top 10 list two weeks in a row. Is Cannabis finally pulling out of its nosedive for good? Probably not, but the ETF sure looks cheap at the moment.

Image Source: ZenInvestor.org
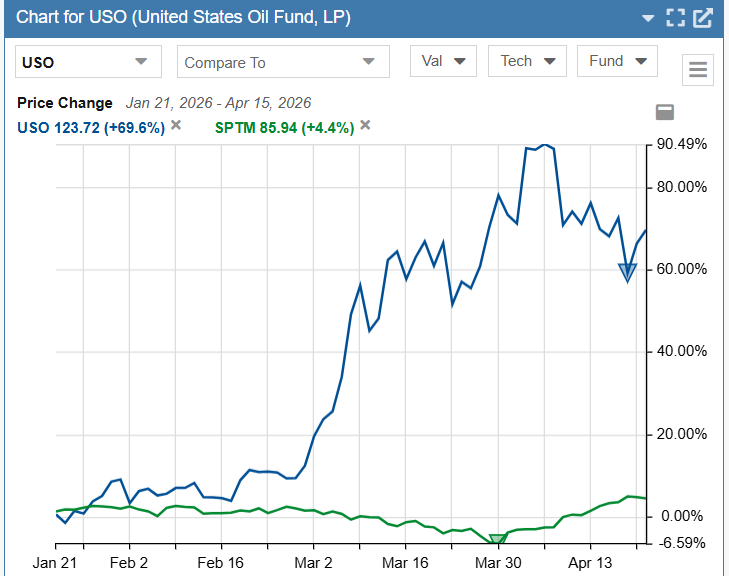
The 10 Worst-Performing ETFs from Last Week
Gold and gold miners sold off as investors rotated into Bitcoin. Oil was down again, as a slowing economy continued to weigh on demand.

Image Source: ZenInvestor.org
The Best-Performing Stocks This Week
Regenxbio Inc. (RGNX) was the big winner this week as Trump’s FDA sent a bullish signal to the Biotech industry.

Image Source: ZenInvestor.org
The Worst-Performing Stocks This Week
SAIA Inc. (SAIA) missed their estimate and guided lower for the rest of 2025.

Image Source: ZenInvestor.org
Final Thoughts
Notwithstanding the four-day, 4.6% rally in the S&P 500 index, the market still appears to be in the middle of a correction. I expect to see another leg down in the weeks ahead, and perhaps a test of the recent low of 4982. I think that level will hold and a bear market will be avoided. The wild card, of course, is the tariff situation. If negotiations go poorly, the economy could slip into a recession, which would change my outlook from cautiously bullish to outright bearish.
To recap this week's action, investors were doing the following:
- Selling gold and buying Bitcoin
- Selling volatility and buying stocks
- Selling energy equities and buying semiconductors
- Selling value stocks and buying growth stocks, especially large-caps
- Selling defensive stocks and buying cyclical names
- Buying the Magnificent 7 (up 9.4% on average) after weeks of heavy selling
More By This Author:
The One-Minute Market Report - Saturday, April 19The One-Minute Market Report - Saturday, March 15
The One-Minute Market Report - Saturday, March 8

Comments
Log in or sign up to join the conversation.