

Image Source: Pexels
In this brief market report, we will take a look at the various asset classes, sectors, equity categories, ETFs, and stocks that moved the market higher, as well as the market segments that defied the trend by moving lower. The idea is to discern newly emerging market leadership.
Identifying these pockets of strength and weakness can often allow us to see the direction of significant money flows, along with their origin.
The Market Correction Continues
Tariff war worries, weakness in consumer spending, recession fears, and declining earnings estimates all drove the market lower. Investors continued to pull back from equities (especially tech stocks), and many sought safety in cash, gold, and Treasury bonds. The S&P 500 was down 1.5% for the week and down 10.2% year-to-date.

Image Source: ZenInvestor.org
The Death Cross
A death cross occurs when the 50-day moving average drops below the 200-day moving average. Market technicians view this as a significant indicator, as it confirms the downside momentum on a long-term basis. It's not very useful as a market timing tool because much of the damage has already been done by the time the signal is triggered.
What it does show is that the recent sell-off is likely to continue for an extended period of time. The good news is that the last time we witnessed a death cross was in January 2023, just as the market was about to deliver back-to-back annual gains of +20%.

Image Source: ZenInvestor.org
A Look at Monthly Returns
This next chart shows the monthly returns for the past year. It appears that April is on track to be the worst month for equity investors in the past 12 months.

Image Source: ZenInvestor.org
A Look at Drawdowns This Year
Here is a closer look at the pullbacks we've had over the last 12 months, using a drawdown chart. The current drawdown is -14% from the Feb. 19 high.

Image Source: ZenInvestor.org
A Look at the Bull Run Since it Began Last October
This next chart highlights the 43% gain in the S&P 500 from the October 2022 low through last Friday's close. It looks to be well below the trendline, and it seems like there may be further to go on the downside before the correction is over.

Image Source: ZenInvestor.org
Major Asset Class Performance
Here is a look at the performance of the major asset classes, sorted by last week's returns. I also included the returns since the Oct. 12, 2022 low for additional context.
The best performer last week was Volatility, reflecting uncertainty about market direction. The worst performer was Blockchain, as Bitcoin and other cryptocurrencies have been under selling pressure recently.

Image Source: ZenInvestor.org
Equity Sector Performance
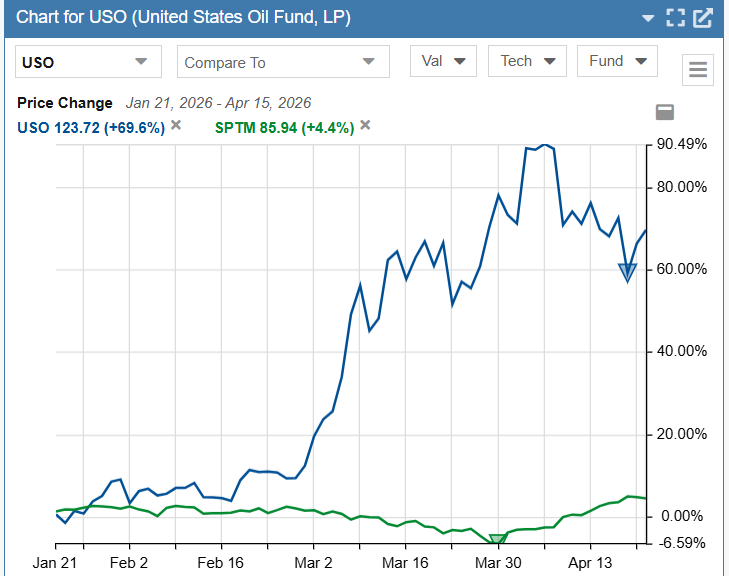
The energy sector saw a boost last week due to several factors. Notably, Cheniere Energy (LNG) stood out with a strong 12% gain. This performance was driven by optimism around long-term growth rates in the industry, as earnings are forecasted to grow by 9.8% annually. Additionally, the sector's valuation remains attractive, with a price-to-earnings ratio of 14x, reflecting investors' low confidence in the recovery of oil prices.
On a year-to-date basis, Utilities is the only sector showing positive momentum. Meanwhile, Tech is the worst-performing sector.

Image Source: ZenInvestor.org

Image Source: ZenInvestor.org
Equity Group Performance
For the groups, I separate the stocks in the S&P 1500 Composite Index by shared characteristics like growth, value, size, cyclical, defensive, and domestic vs. foreign.
The best-performing equity groups were foreign stocks and small-cap value stocks. The Magnificent 7 stocks led the way down once again.

Image Source: ZenInvestor.org
The S&P 500 Mag 7
Here is a closer look at the Magnificent 7. These stocks are in a bear market year-to-date, down by 22%. Faith in the AI trade is being tested. Nvidia (NVDA) was hit the hardest, as it slumped down 8.5% for the week.

Image Source: ZenInvestor.org
The Mag 7's Dominance Is A Drag on Performance
After leading the market higher for the last two years, the Magnificent 7 are now a drag on the S&P 500 index on a year-to-date basis. The other 493 stocks in the S&P 500 are only down an average of 3.1% year-to-date.

Image Source: ZenInvestor.org
The 10 Best-Performing ETFs from Last Week
The long-suffering Cannabis stocks, as shown by the MSOS ETF, finally caught a bid last week, up nearly 15%. This seemingly shows that investors are hunting for value and tariff-resistant stocks.

Image Source: ZenInvestor.org
The 10 Worst-Performing ETFs from Last Week
Semiconductors, as shown by the SMH ETF, have continued to sell off as the tariff picture remained rather murky. Chip companies like Nvidia must now obtain a license to export to China, effectively shutting down one of their largest markets.

Image Source: ZenInvestor.org
The Best-Performing Stocks from Last Week
With tariffs on auto imports, Hertz (HTZ) and Avis (CAR) got a boost this week. Looking at the list of winning stocks reveals that 4 are from the Healthcare sector. This sector has been lagging the market so far this year, but it may be poised for a rebound.

Image Source: ZenInvestor.org
The Worst-Performing Stocks from Last Week
UnitedHealth (UNH) shares took a nosedive on Thursday after slashing its annual outlook. The healthcare conglomerate posted quarterly earnings that fell short of Wall Street’s expectations and substantially downgraded its projected results for 2025.

Image Source: ZenInvestor.org
Final Thoughts
It looks to me like we're going to be stuck in correction mode for longer than just a few weeks. Now that long-term momentum has turned negative, it will probably take several months to climb out of the hole we've dug for ourselves. To recap, in the week just past, investors were doing the following:
- Selling Bitcoin and buying gold
- Selling stocks and buying volatility (VIX)
- Selling semiconductors and buying energy
- Selling growth stocks and buying value stocks, especially small- and mid-cap names
- Selling cyclicals and buying defensive names
- Selling the Magnificent 7 stocks and building cash positions
More By This Author:
The One-Minute Market Report - Saturday, March 15The One-Minute Market Report - Saturday, March 8
The One-Minute Market Report - Saturday, March 1


Comments
Log in or sign up to join the conversation.