
Sector And Index Ratios
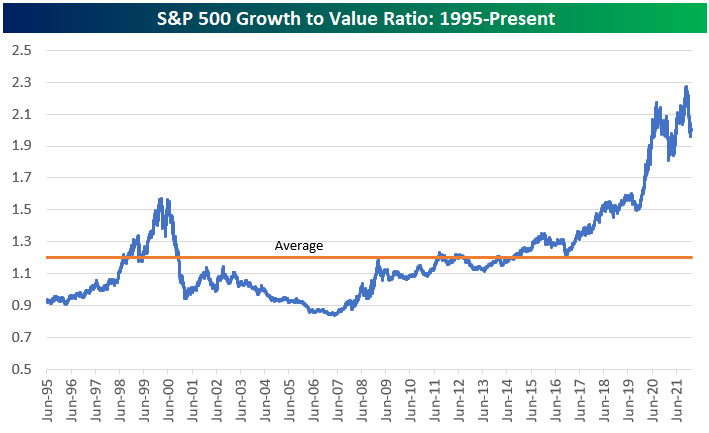
Today we wanted to highlight a number of charts looking at the historical ratio between different stock market indices, sectors, or ETFs. In the first chart, we show the historical ratio between the S&P 500 Growth and Value indices going back to 1995. In this chart, a rising line means Growth is outperforming Value, while a falling line means Value is outperforming Growth. As you can see, Value had a long period of outperformance during the early and mid-2000s after the Tech Bubble burst, but Growth has generally been trending higher versus Value since 2007. The last five years (especially at the onset of the COVID outbreak) saw Growth rapidly outperform Value, taking the ratio to new highs. Over the last month or so, we have seen Value perform well while Growth has stumbled, but this ratio is still significantly above its historical average.
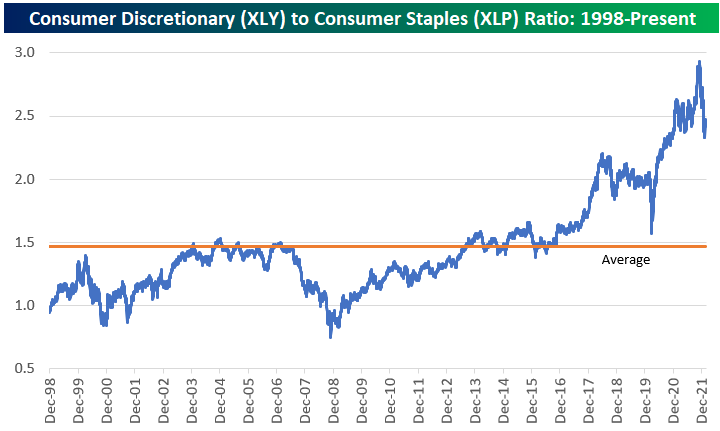
The Consumer Discretionary (XLY) to Consumer Staples (XLP) ratio is somewhat similar to Growth versus Value, as discretionary goods and services are viewed as cyclical while staples are viewed as defensive and non-cyclical. The Consumer Discretionary sector is also heavily weighted towards Amazon.com (AMZN) and Tesla (TSLA). Consumer Discretionary has significantly outperformed Consumer Staples going back to the mid-2010s, but the ratio has dropped quite dramatically over the last couple of months similar to the drop seen during the COVID Crash in February and March 2020. Here again, though, the ratio remains well above its long-term average even after its recent drop.
The S&P 500 Technology (XLK) to Utilities (XLU) ratio is another interesting sector ratio chart. This ratio exploded higher during the late 1990s Tech Bubble, but then it plunged from the peak in early 2000 and continued lower right through the Financial Crisis that ended in early 2009. After hitting 2.5 at the peak of the Dot Com Bubble, the ratio got all the way down to 0.5 at its low. Just recently, the ratio briefly ticked above 2.5, eclipsing it's prior high made more than 20 years ago. While the Tech sector has struggled over the last couple of months as the prospect of higher interest rates has weighed on growth stocks, this ratio shows that there is still A LOT to unwind if a new secular shift has begun.

Below we show the ratio of the S&P 500 to the Philly SOX Semiconductor index going back to 1994. In this chart, a rising line means the S&P 500 is outperforming semis, while a falling line means the semis are outperforming. As the “Transports of the 21st Century,” many investors view the semiconductor group as a leading indicator for the broad market. In the bull market of the mid-2000s that followed the bursting of the Dot Com bubble, the S&P actually outperformed the semis throughout. Since the end of 2012, however, we’ve seen the semis steadily outperform. While the semis have underperformed slightly over the past month or so, the move thus far hardly registers on the long-term ratio chart.

Our final two charts relate to the U.S. versus international equity markets. Below we highlight the ratio of the S&P 500 (SPY) ETF to the All-World ex-US ETF (CWI) going back to 2007. While international markets outperformed the U.S. coming out of the Dot Com bust during the early and mid-2000s, the U.S. has absolutely crushed the rest of the world over the last ten years. At the moment, the ratio between SPY and CWI is just below its all-time high of 16, which is nearly double the historical average. Similar to growth versus value, the relationship between the U.S. stock market and the rest of the world has stretched dramatically in recent years.

The emerging markets ETF (EEM) goes back to 2003, so we can see its ratio versus the S&P 500 (SPY) a little further back than CWI (shown above). After outperforming SPY significantly from 2003 through 2008, EEM has been underperforming ever since. This is another ratio that has a lot to unwind to get back to “average” levels if a big shift were to occur.

Disclaimer: For more global markets and macroeconomic coverage, make sure to check out Bespoke’s Morning Lineup and nightly Closer notes, as well as our ...
more

