
Volatility laundering causes the risk-adjusted returns and the diversification benefits of private equity to be significantly overstated. However, the problem of volatility laundering is not a problem for all private investments, specifically not for high-quality, floating rate, private credit.

Advisors (and investors) considering allocations to private equity are often presented with charts like the one below from the study “Does the Case for Private Equity Still Hold?,” showing that adding private equity will improve portfolio efficiency as it has provided higher returns with less volatility than public market equivalents.
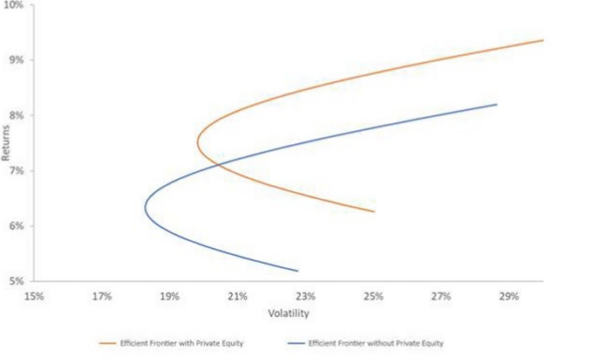
The results are hypothetical results and are NOT an indicator of future results and do NOT represent returns that any investor actually attained. Indexes are unmanaged and do not reflect management or trading fees, and one cannot invest directly in an index.
Here is another example from Cliffwater Research, covering the period September 2004 through December 2023, which includes private direct lending as well as private equity.
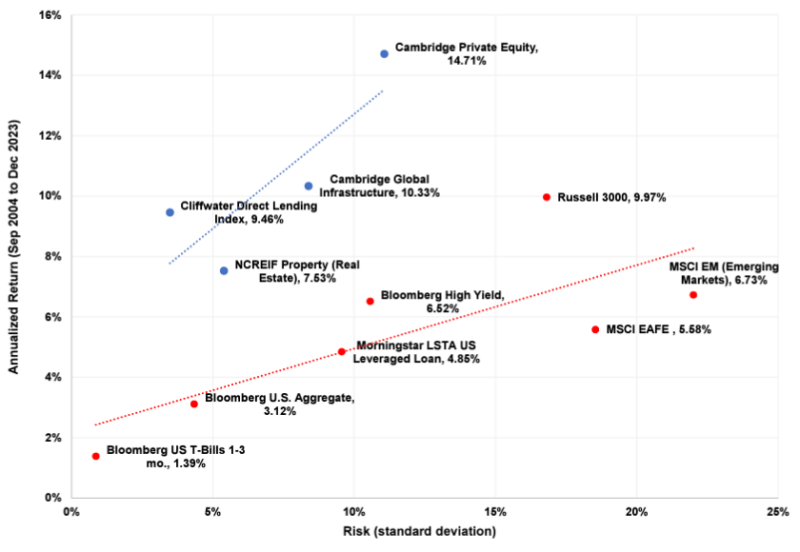
The results are hypothetical results and are NOT an indicator of future results and do NOT represent returns that any investor actually attained. Indexes are unmanaged and do not reflect management or trading fees, and one cannot invest directly in an index.
Private Equity
Private equity firms pitch that they have achieved these results by identifying appropriate target companies at “bargain” prices, creating operational improvements that lead to earnings growth and multiple expansion, restructuring the portfolio companies’ balance sheets primarily by adding significant leverage and exiting the investment at the appropriate inflection point.
However, reality suggests that what is really happening is what is referred to as “volatility laundering”—a critical term (attributed to AQR’s Cliff Asness) used to describe how private equity funds understate the actual risk involved in their investments. Nori Lietz and Philipp Chvanov, authors of the April 2024 paper “Does the Case for Private Equity Still Hold?”, rhetorically posed the question: Does any rational, knowledgeable investor genuinely believe a private investment in a private company leveraged 65% is less risky than a comparable public company leveraged 30%? What’s really going on? Before answering the question we need to address the liquidity factor and the difference in liquidity of public and private markets.
Liquidity Factor
The liquidity factor refers to the efficiency with which an asset or security can be converted into cash without negatively impacting its market price. The more liquid an asset is, the easier and more efficient it is to turn it back into cash. Less liquid assets take more time and typically incur greater costs to convert to cash. Because publicly traded assets are more liquid, investors are willing to pay a higher price and consequently accept a lower return.
Advisors (and investors) should also be aware that the value of this liquidity option is time varying, positively correlated with market uncertainty—in periods of market distress liquidity becomes very expensive.
Volatility Laundering
The reality is that publicly traded stocks have their prices constantly adjusted throughout the day, reflecting market sentiment, leading to lots of volatility. It’s the high volatility of equities—since 1926 the S&P 500 Index has experienced annual volatility of about 19%—that creates the potential problem of volatility laundering.
Private equity, which invests in unlisted companies, typically value their holdings only quarterly. The result is that because their valuations are less frequent, private equity returns appear smoother, with less volatility compared to public markets.
In the second chart above it shows that the volatility of private equity was dramatically lower than that of public markets, as represented by the Russell 3000 over the period of September 2004 to December 2023. That just is not credible, especially since private equity companies tend to be much smaller on average and are also more leveraged, and thus more, not less, volatile.
Nicolas Rabener contributes to the private equity literature with his study “Private Equity Is Still Equity, Nothing Special Here,” published in the December 2020 issue of “The Journal of Investing.” He found that the volatility of private equity returns is understated as a result of smoothing, and the risk-adjusted returns are comparable to those of public equities. An unsmoothing approach results in comparable standard deviations of returns for private equity. He also found that U.S. private equity returns could be replicated systematically through public equities, historically by selecting small, cheap and levered stocks. Since small value stocks are significantly more volatile than the overall stock market, the implication is that advisors including allocations to private equity in client portfolios should increase their volatility assumption to about 20% greater than for public equities.
For those with short memories, here is a good example of volatility laundering. Does anyone believe that in the first quarter of 2020 when the COVID crisis caused the S&P 500 to fall about 20%, that private valuations (which in most cases ultimately depend on public markets to be taken out) only fell by a fraction of that amount, if at all?
The valuations provided by PE fund managers can create a false sense of security for investors who unknowingly are exposed to more risk than the reported figures suggest. This can lead to large problems during extended bear markets and the true value of the private equity holdings falling sharply and is revealed. The problem is compounded if an advisor fails to adjust the volatility of private equity to about 20% above public equities when running Monte Carlo Simulations that are used to determine the client’s safe withdrawal rate. Does the problem of volatility laundering, and the allocation mistakes it can lead to, apply also to private direct lending? The answer is yes. However, the degree it matters depends greatly on the credit quality and the duration of the loans.
Private Direct Lending
While nonbank loan channels have always coexisted with traditional banking, those channels were historically small niches in the overall economy. That changed after the Great Recession when new regulations limited the ability of banks to make traditional loans to U.S. middle-market businesses (generally defined as companies with EBITDA, or earnings before interest, taxes, depreciation and amortization between $10 million and $100 million and which are considered by many too small to access capital in the broadly syndicated market in a cost-efficient manner). “Shadow banking” emerged with independent asset managers funded by capital from institutional investors, replacing banks as providers of secured, first lien commercial loans.
The growth in direct middle-market loans originated by asset managers is partly explained by the growth in middle-market private equity. Those loans are referred to as “sponsor backed.” Private equity sponsors often prefer to borrow from asset managers rather than traditional banks because asset managers offer faster speed, certainty of execution and greater financing flexibility. In its year-end “2023 Q4 Report on U.S. Direct Lending,” Cliffwater Direct Lending Index (CDLI), an asset-weighted index of approximately 14,800 directly originated middle-market loans, reported a total of $315 billion.
We’ll begin by noting that debt is less risky than equity, and thus volatile. That reduces, but not eliminates the problem of volatility laundering. We turn now to the issue of credit risk.
As in the case with equities, private credit spans a wide variety of risk assets from high-quality, low-duration loans to lower-quality, higher-duration loans. Let’s examine how this affects the issue of volatility laundering where the more volatile the asset, the greater the issue becomes. We’ll focus on the higher quality segment of the private credit market—the only kind I would recommend investing in—using Cliffwater’s Direct Lending Indices.
The Cliffwater Direct Lending Index is used globally by institutional investors and asset managers as the index of choice for understanding the return and risk characteristics of U.S. middle-market debt. Launched in 2015, the CDLI was reconstructed back to 2004 using publicly available quarterly SEC filings required of business development companies whose primary asset holdings are U.S. middle-market corporate loans. Importantly, SEC filing and transparency requirements eliminate common biases of survivorship and self-selection found in other industry universe and index benchmarks.
The following table provides performance data for the fourth quarter of 2023 as well as historical returns:

The results are hypothetical results and are NOT an indicator of future results and do NOT represent returns that any investor actually attained. Indexes are unmanaged and do not reflect management or trading fees, and one cannot invest directly in an index.
As you can see, the net losses from defaults have averaged around 1%. While riskier than U.S. Treasuries, they have been significantly less risky than high-yield bonds and dramatically less risky than equities. Since the problem of volatility laundering increases with the risk of an asset, and you have seen that the loans in the CDLI are relatively safe assets, if there is an issue related to volatility laundering, the magnitude of the problem is greatly reduced.
Cliffwater also produces the CDLI-S index which consists of loans that are senior, secured and backed by private equity. As you can see, the net credit losses have been only 0.25% per annum. Since the higher the quality of loans, the lower their volatility, the issue of volatility is further diminished when limiting loans to those in this category.
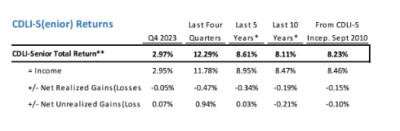
The results are hypothetical results and are NOT an indicator of future results and do NOT represent returns that any investor actually attained. Indexes are unmanaged and do not reflect management or trading fees, and one cannot invest directly in an index.
We now turn to the issue of duration. The longer the duration, the greater the volatility and the greater the issue of volatility laundering. Loans in both the CDLI and CDLI-S are all floating rate loans with reset maturities of either one or three months. Thus, there is virtually no maturity risk, minimizing the risk of volatility laundering.
Summarizing, while volatility laundering is a huge problem, misleading equity investors about the risks of private equity, for investors in high quality, floating rate, private credit the issue is greatly diminished. To demonstrate that point we can compare the volatility of Cliffwater’s Corporate Lending Fund —whose investment universe is based on the CDLI-S—to that of the iShares Floating Rate Bond Fund (FLOT). Unlike private equity, Cliffwater does mark-to-market the loans in the portfolio on a daily basis, using a formula based on public market valuations.
From inception in July 2019 through March 2024, the volatility of CCLFX has been 1.94% versus the 2.6% volatility of FLOT. Given that the durations are the same, we should expect to see that FLOT, with its stronger credit profile have lower volatility—93% of FLOT’s loans are A-rated or better, with just 7% BBB rated. As of the end of April, Morningstar showed the fund’s average credit rating was A+. While CCLFX’s loans are not rated, if they were publicly traded loans, Cliffwater estimates that their rating would be BBB.
The bottom line is that CCLFX’s volatility might be slightly understated, perhaps by as much as 1% or 2%. But that is much less than the amount of underreporting of volatility in private equity (as shown in the first chart in this article). It is also a small percentage compared to the difference in returns between CCLFX and FLOT. Over the period July 2019 (inception of CCLFX) through March 2024, CCLFX returned 9.30%, outperforming the 2.60% return of FLOT by 6.7%. The difference in performance reflects both a relatively small credit risk premium and very large illiquidity premium (CCLFX is an interval fund that provides a minimum of 5% liquidity per quarter). With that in mind, consider the following. As of the end of April 2024, the credit spread between AA and BBB public loans was only about 0.5%. The yield to maturity for FLOT was about 6%, while the yield to maturity of CCLFX was about 12%, a gap of about 6%, as the Morningstar data shows. Since credit risk represents only about 0.5% of the differential, the remainder (about 5.5%) must be an illiquidity premium. For investors who don’t need liquidity for all of their assets that is an extremely large spread, especially considering that CCLFX is paying a distribution yield of about 10% and provides a minimum of 5% liquidity per quarter. The result is that investors today are likely to be able to withdraw at least 30% of their assets within one year should they need/desire to. Of course, an economic recession would likely cause the distribution yield to fall significantly (helping to explain the illiquidity premium).
Words of Caution
First, the CDLI-S data series is relatively short, less than two decades. With risk assets we need much longer series to have confidence that the results were not due to a lucky draw where economic volatility was low and drawdowns were of short duration. This was the case over the last 15 years. In the case of the CDLI it does cover two full decades, which includes the great financial crisis, a period of large drawdowns for risk assets. In addition, the CDLI loans are the equivalent of BBB-rated public loans for which we do have a much longer data series.
Second, the great financial crisis and ensuing greater capital requirements negatively impacted the ability of banks to provide loans to businesses. While private credit has stepped it, the gap between what the banks had historically provided and what private credit has been able to provide remains wide. Private credit has benefited as the limited supply has allowed for credit standards to be tight (with strong covenants and low LTVs) and spreads to remain wide. As investors become more familiar, and more comfortable, with interval funds and their limited liquidity, credit spreads could narrow, resulting in a lower liquidity premium. That could lead to some funds stretching for yield by taking more credit risk. Thus, the choice of fund manager is critical. Investors should consider only those funds with long histories of focusing on credit quality, not yield.
Third, the laundering of volatility in private equity, creating the illusion of lower volatility, has led some investors, including institutional investors, to increase their allocations. The result may be that the historical spread in valuation between private equity and public equity (which resulted from the illiquidity premium) has shrunk. In fact, some have even argued that it may have disappeared.
Fourth, fund expenses and fees (such as carried interest) play an important role in determining returns earned by investors. Fortunately, competition has driven fees lower from the traditional 2/20 fees charged by most private credit funds. In addition, investors should be aware that some funds charge on gross assets (which include the assets acquired through leverage), as many do, instead of net assets (as Cliffwater, for example, does).
Investor Takeaway
Volatility laundering is a tool used by promoters of private equity in an attempt to increase investor allocations to the asset class. That doesn’t make private equity a bad investment, though for investors relying on laundered volatility it does dramatically understate the risks. However, the problem of volatility laundering is not a significant issue when investing in private direct lending funds consisting of loans that are senior, secured and backed by private equity firms.
Post-Script
Note that volatility laundering is notorious in private real estate. Thus, one needs to be very careful when evaluating the performance of private versus public REITS.
More By This Author:
The Halo Effect Drives Demand For Sustainable And Impact InvestmentsMomentum Everywhere, Even Cross-Country Factor Momentum
Valuing Artificial Intelligence Stocks

Comments
Log in or sign up to join the conversation.