
Gold May Get Stronger In The Coming Weeks
SPX Monitoring purposes; Long SPX on 2/25/25 at 5955.25.
Our gain 1/1/24 to 12/31/24 = 29.28%; SPX gain 23.67%
Our Gain 1/1/23 to 12/31/23 SPX= 28.12%; SPX gain 23.38%
Monitoring purposes GOLD: Long GDX on 10/9/20 at 40.78.
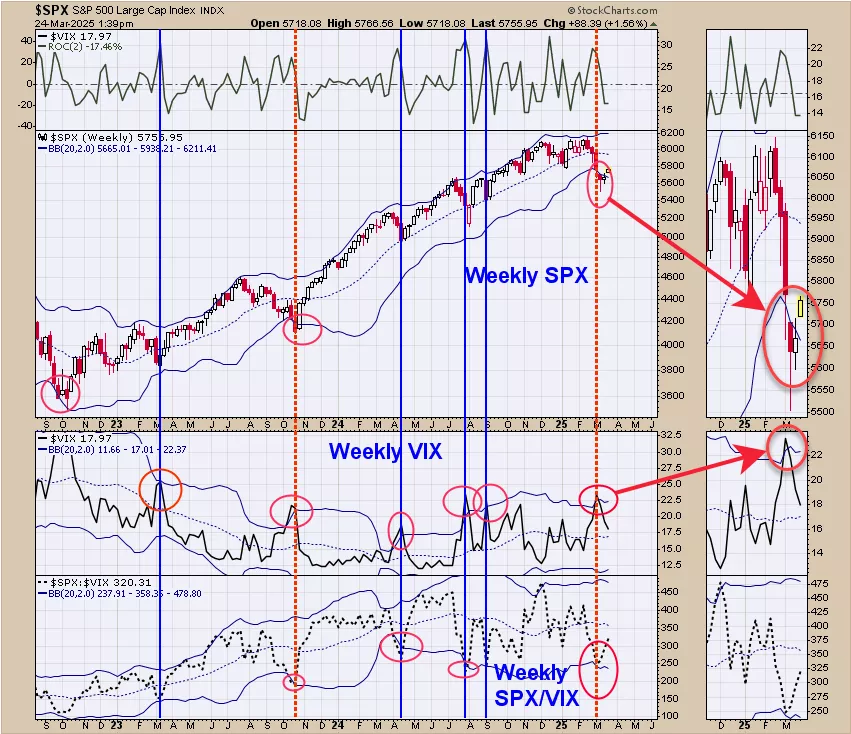
We ended up 29.28% for 2024; SPX up 23.67% for the year. We updated this chart from our previous report. The rally in SPX we where predicting appears to have started, “Above are the weekly VIX (Bottom window) and the weekly SPY (next window higher). We noted with blue and red lines when the weekly VIX reached it upper Bollinger band (circled in red) which in turn corresponded with low in the SPY. We noted with red dotted lines when the weekly SPY closed below its’ lower Bollinger band which also corresponded with lows in the SPY. We have two weekly reliable signals suggests the SPY is at a low. In our opinion the worst case scenario is a test of the low two week ago (near 5500 SPX). Most signal of this type rally back to the mid Bollinger band at a minimum, which comes in near 5950 SPX range.” Bullish Seasonality runs into mid April and rally could extend into that timeframe.
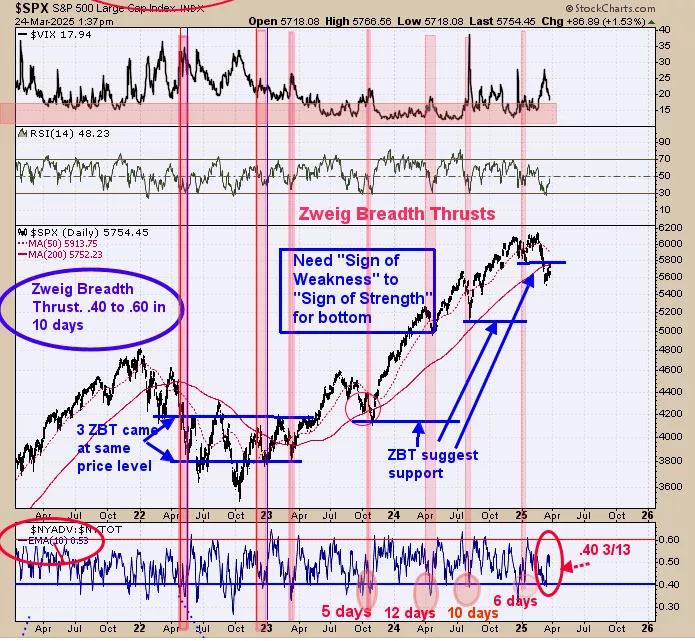
The bottom window is the Zweig Breadth Thrust indicator (ZBT). The ZBT is the NYSE advancing issues/NYSE total issues with a 10 day average. ZBT is triggered when the 10 day average trades .40 or lower (reached .40 on 3/13) and then rallies to .60 or higher within 10 days or less. March 27 (Thursday) will mark the 10 trading day for the ZBT to reach .60 or higher. A ZBT triggered suggests a bull market is in progress. A ZBT was triggered back in January and another one triggered would add to the bullish picture. We shaded in pink previous ZBT’s on chart above.
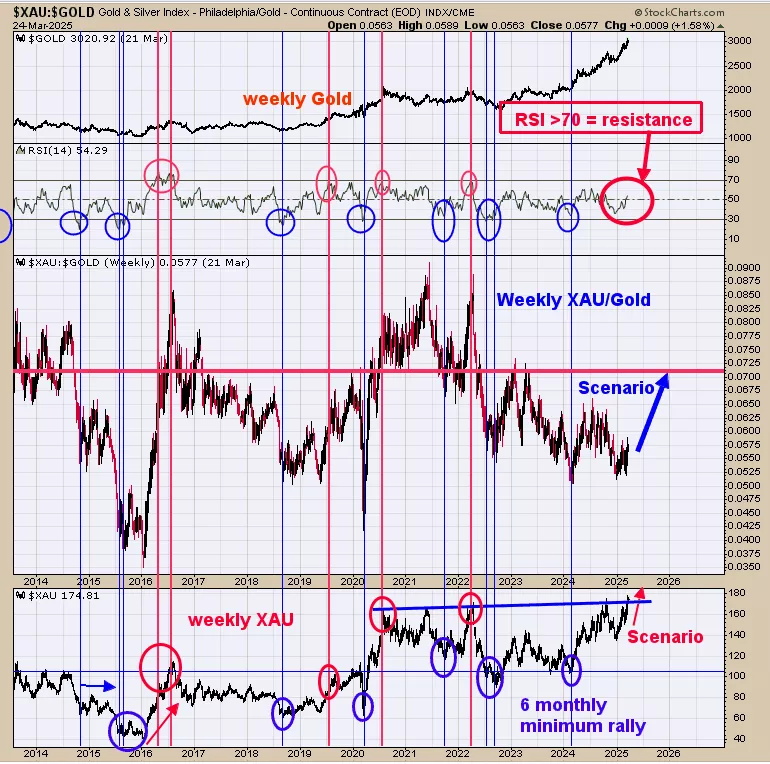
The middle window is the weekly XAU/Gold ratio and above that is the RSI for this ratio. Intermediate term highs occur when the weekly RSI for this ratio reaches >70. The bottom window is the weekly XAU and we noted with red lines the times when the weekly RSI for the weekly XAU/Gold ratio reached >70; which market near highs for the XAU. The current RSI reading stands at 54.29 and not near 70 bearish level, suggesting this ratio has room to run and in turn for the XAU to rally. The weekly XAU (bottom window) is testing a trend line dating back to 2020 and to get through this trend line will need a “Sign of Strength”, suggesting the XAU may get stronger in the coming weeks. The pattern forming on the XAU going back to 2020 looks like a Head and Shoulders pattern; this pattern has a measured target near 255. When the weekly RSI reaches >70 for the XAU/Gold ratio will suggests the XAU is extended and do for a rest.
More By This Author:
A Multi Week Rally Is StartingA Low In The Market Is Near
Higher Volatility Is Nearing
Signals are provided as general information only and are not investment recommendations. You are responsible for your own investment decisions. Past performance does not guarantee future performance. ...
more

