

Image Source: Pexels
SPX Monitoring purposes; Sold SPX on 2/12/25 at 6051.97 = gain .66%; Long SPX on 1/27/25 at 6012.28.
Our gain 1/1/24 to 12/31/24 = 29.28%; SPX gain 23.67%
Our Gain 1/1/23 to 12/31/23 SPX= 28.12%; SPX gain 23.38%
Monitoring purposes GOLD:Long GDX on 10/9/20 at 40.78.
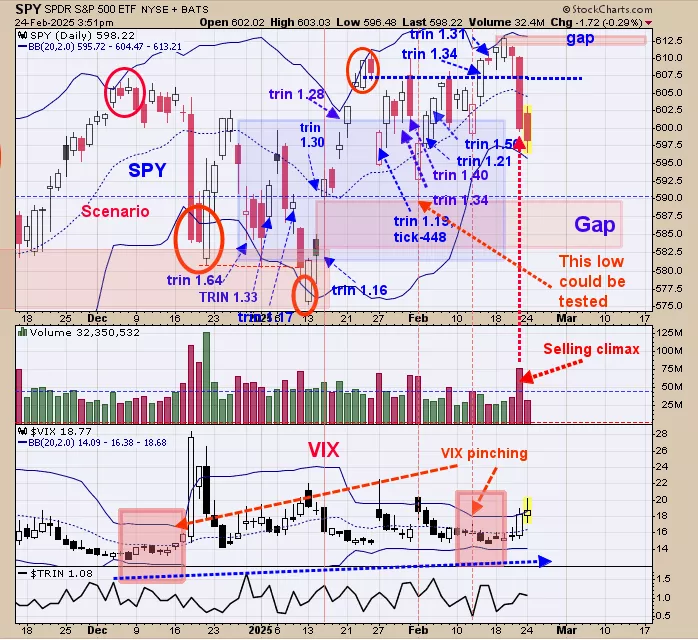
We ended up 29.28% for 2024; SPX up 23.67% for the year. Friday’s decline produced a “Selling Climax” suggesting exhaustion to the downside and that a low in the market is near by. SPY is also testing the “blue shaded area” which is where the TRIN closed in panic levels near 1.20 and higher and panic forms near lows. Seasonality leans bearish into Friday and a worth while low may form this week. There is a possibility that the gap (starting near 590 SPY) and 2/3 low may be touched (both lie near same level). Bullish signs are present; staying neutral for now.
(Click on image to enlarge)
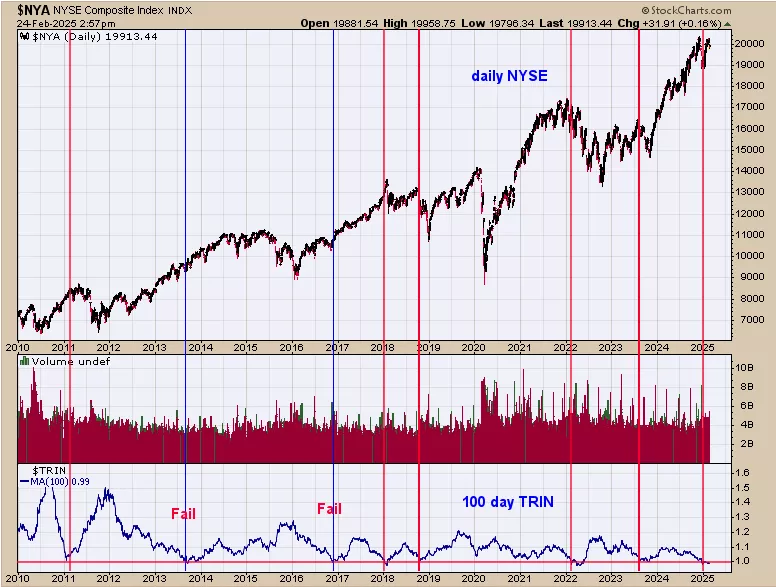
We have shown this chart in the past; it gives a big view on the bigger picture for the market. The bottom window is the 100 day average of the trin and top window is the NYA. This chart goes back to 2010 and shows the times when the 100 day TRIN reached below 1.00 (current reading is .99). Going back to 2010 the 100 day trin reached <1.00 eight times and 6 of those times (75%) the market was at an intermediate term top. Where’re getting evidences that this year may be more of a sideways pattern then a down pattern.Things may change and we will change with them. For near term we are starting to see panic in volume studies suggesting a short term low is not far off.
(Click on image to enlarge)
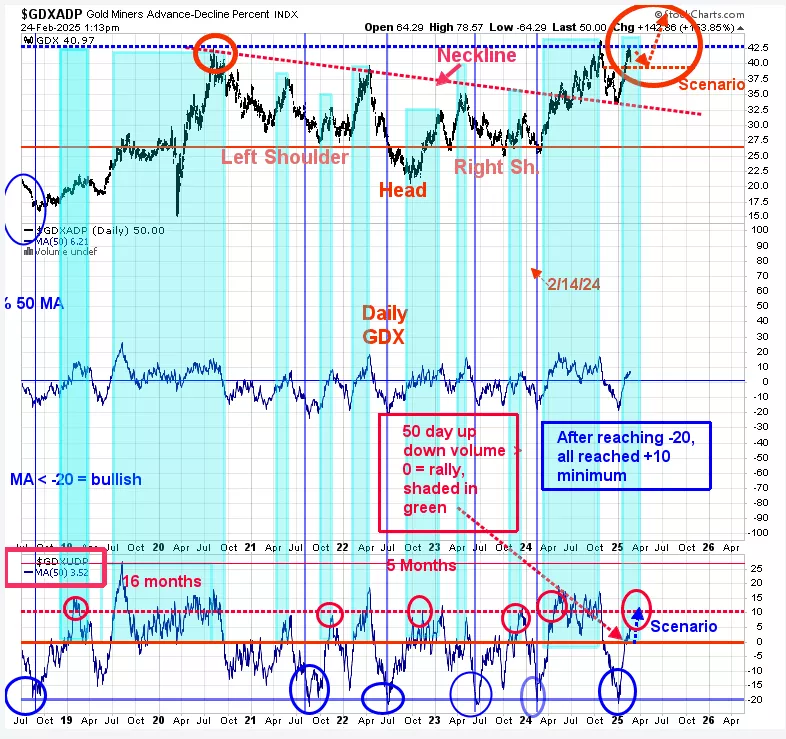
We updated this chart from last Thursday; last Thursday’s commentary still applies, “The monthly and weekly charts remain on a buy signal for GDX; short term however, a consolidation is possible (noted in previous reports). Turn your attention to the top window, which is the daily GDX going back to mid 2018. GDX is testing the highs of 2020, 2024 near the 43.00 level. Our view is that GDX may stall here for a short while before breaking through the 43.00 level. Support lies near the 39.00 level which is the previous highs and most likely an area to add. Breaking through the 43.00 area will require a “Sign of Strength” (high volume strong rally) and could be quite dramatic. The strongest part of GDX rally is in front of us.”
More By This Author:
Higher Volatility Is Nearing
Seasonality Has Turned Bullish
Rally Starting Soon


Comments
Log in or sign up to join the conversation.