
Seasonality Has Turned Bullish

Image Source: Pexels
SPX Monitoring purposes; Long SPX on 1/27/25 at 6012.28.
Our gain 1/1/24 to 12/31/24 = 29.28%; SPX gain 23.67%
Our Gain 1/1/23 to 12/31/23 SPX= 28.12%; SPX gain 23.38%
Monitoring purposes GOLD:Long GDX on 10/9/20 at 40.78.
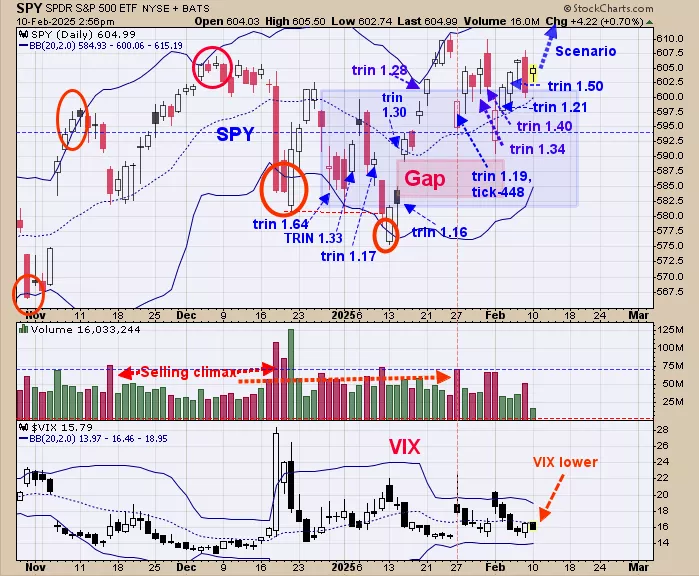
We ended up 29.28% for 2024; SPX up 23.67% for the year. We shaded in light blue where the TRIN closes came in near 1.20 and higher, which suggests panic is present and panic only forms near bottoms. The panic TRIN closes group between 582 to 600 SPY ranges suggesting a large support area. Of the last 11 trading days the TRIN close came in panic levels five times, producing energy to rally the market. Seasonality has turned bullish and lasts into Mid February. Another rally to new highs is possible short term. Long SPX on 1/27/25 at 6012.28.
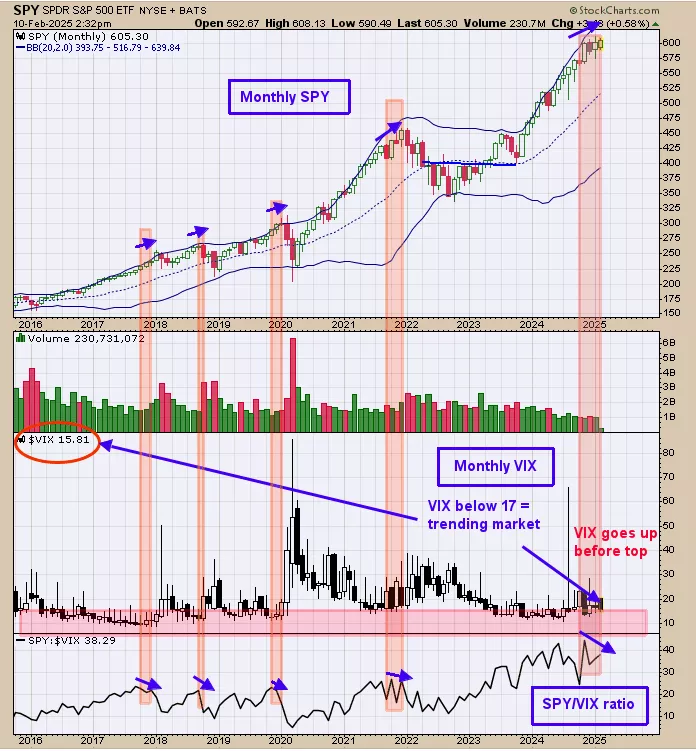
Above is the monthly SPY (top window); bottom window is the monthly SPY/VIX ratio. Monthly chart rule the weekly charts and weekly charts rule the daily charts and so on. Turn your attention to the monthly SPY/VIX ratio. Notice that in January the SPY traded at a new high and the monthly SPY/VIX ratio made a lower high. We noted times past when this scenario was present which we shaded in light pink and it had previously marked high in the SPY. We have evidence that the SPY may touch a new high soon and if it does and the SPY/VIX fails again to make a higher high will suggest a bearish setup.

The chart above provides information of what the short term trend is doing for GDX. The bottom window is the 18 day average for the up down volume and next higher window is the 18 day average for the advance/decline; both for GDX. Up trends in GDX are in force when both indicators are above -10 and both are in the + 20 range suggesting an uptrend is in progress. We shaded in green the times when both indicators were above -10 and shaded in light pink the times when both indicators were below -10.
More By This Author:
Rally Starting Soon
“Zweig Breath Thrust indicator”
2025 May Be A Difficult Year
Signals are provided as general information only and are not investment recommendations. You are responsible for your own investment decisions. Past performance does not guarantee future performance. ...
more

