
“Zweig Breath Thrust Indicator”
SPX Monitoring purposes; Sold long 1/6/25 at 5975.38 = gain 1.59%; Long SPX on 12/31/24 at 5881.63.
Our gain 1/1/24 to 12/31/24 = 29.28%; SPX gain 23.67%
Our Gain 1/1/23 to 12/31/23 SPX= 28.12%; SPX gain 23.38%
Monitoring purposes GOLD: Long GDX on 10/9/20 at 40.78.
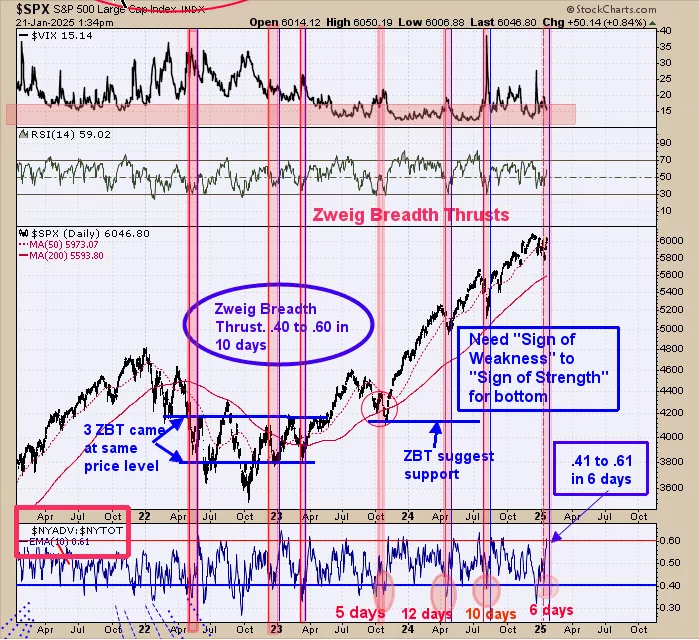
We ended up 29.28% for 2024; SPX up 23.67% for the year. The above chart goes back near 5 years. The bottom window is the “Zweig Breath Thrust indicator” (ZBT). A ZBT is triggered when the 10 day average of the NYSE advance/NYSE Total reaches .40 or lower and than rallies to .60 or higher within 10 days or less. ZBT reached .41 (close enough) on 1/10/25 and reached .61 today (6 days); triggering a ZBT. It is said that ZBT only show up in bull market.
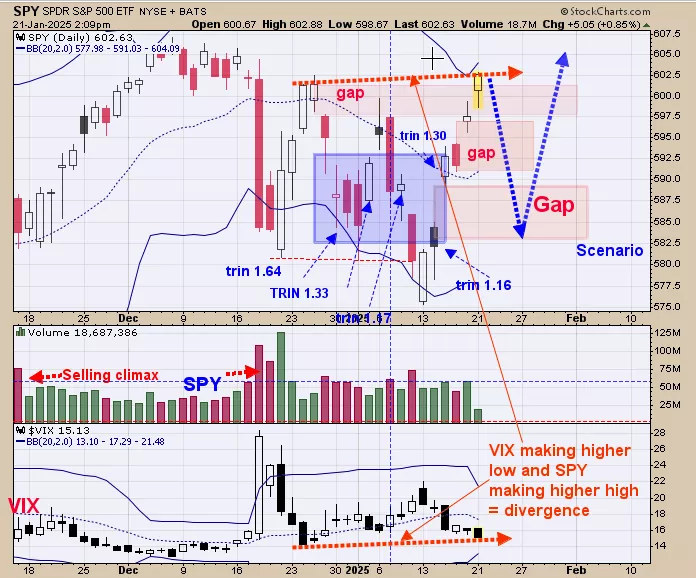
We did shaded in blue the trin closes that are near or in bullish levels on the chart above and all came in near the 583-592 SPY level; which suggest support. A ZBT setup was triggered today (see page one) suggesting a bull market is still alive. Lots of gap on the chart above (noted shade pink) and most will get filled at some point. A new short term high in the SPY today above the late December high was hit today and the VIX made a higher low producing a divergence. Volume was strangely low today and a bearish sign. A stronger setup may come late this week or early next week according to seasonality.
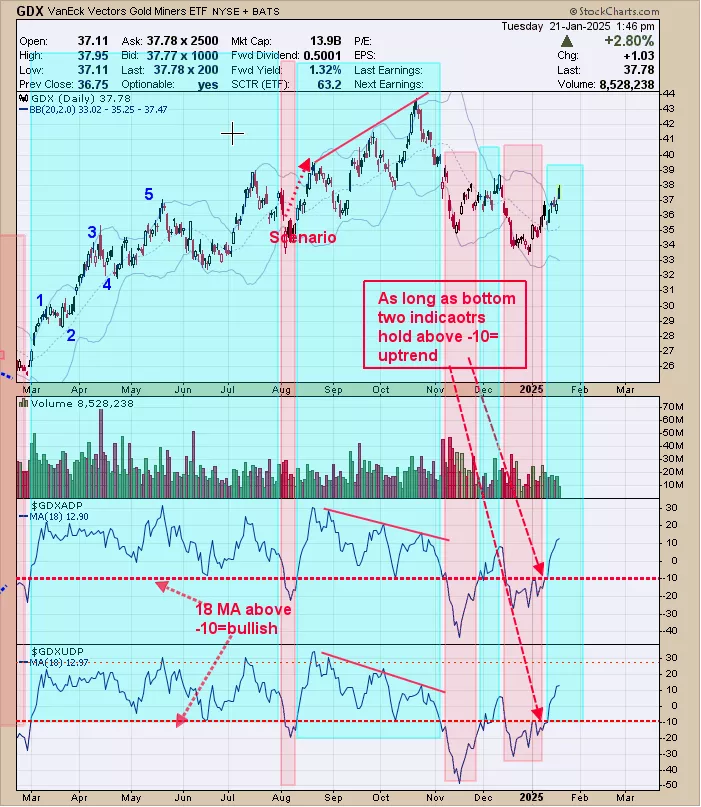
The bottom window is the 18 day average of the up down volume percent for GDX and next higher window is the 18 day average of the advance/decline percent for GDX. These two indicators are good in helping to define the short term trend form GDX. When both indicators are above -10 (both where +12 range today) the short term trend for GDX is considered up. We noted in light green the times when both indicators are above -10 and in pink when both indicators are below -10. The chart above goes back about a year and 80+% of the time it’s been in the light green area.
More By This Author:
2025 May Be A Difficult Year
Market Could Remain Mixed
Large Declines Can Occur
Signals are provided as general information only and are not investment recommendations. You are responsible for your own investment decisions. Past performance does not guarantee future performance. ...
more

