
Higher Volatility Is Nearing

Image Source: Pexels
SPX Monitoring purposes; Sold SPX on 2/12/25 at 6051.97 = gain .66%; Long SPX on 1/27/25 at 6012.28.
Our gain 1/1/24 to 12/31/24 = 29.28%; SPX gain 23.67%
Our Gain 1/1/23 to 12/31/23 SPX= 28.12%; SPX gain 23.38%
Monitoring purposes GOLD:Long GDX on 10/9/20 at 40.78.
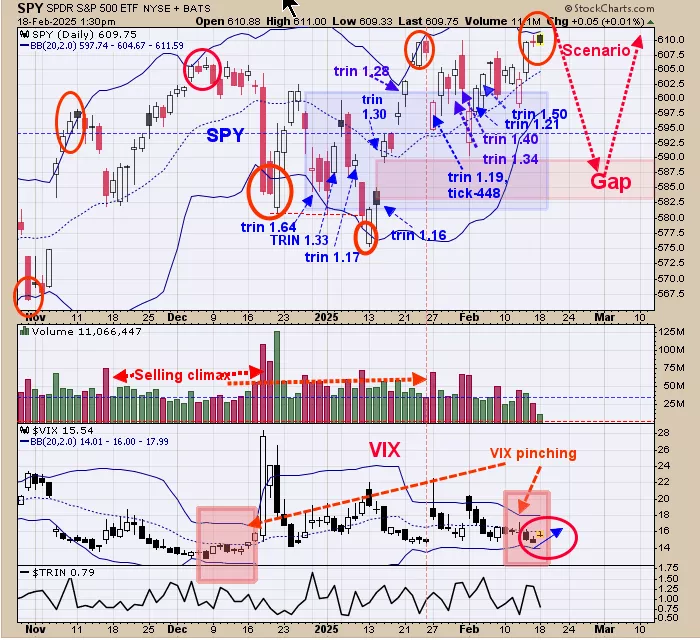
We ended up 29.28% for 2024; SPX up 23.67% for the year.We shaded in light blue where the TRIN closes came in near 1.20 and higher, which suggests panic is present and panic only forms near bottoms. The panic TRIN closes group between 582 to 600 SPY ranges suggesting a large support area and may define the trading range for this year. This week is option expiration week which usually leans bullish and market could hold up this week. The second window up from the bottom is the VIX and we noted in shade square pink boxes where the Bollinger bands area pinching. Pinching of Bollinger bands suggest higher volatility is nearing which usually comes in the form of a decline in the market. Today’s trading was near unchanged and the VIX was up suggesting upside on the SPY is limited. Most likely SPY is near a high. Could see at some point a pull back to test the gap area near 585 SPY (see scenario above).
(Click on image to enlarge)
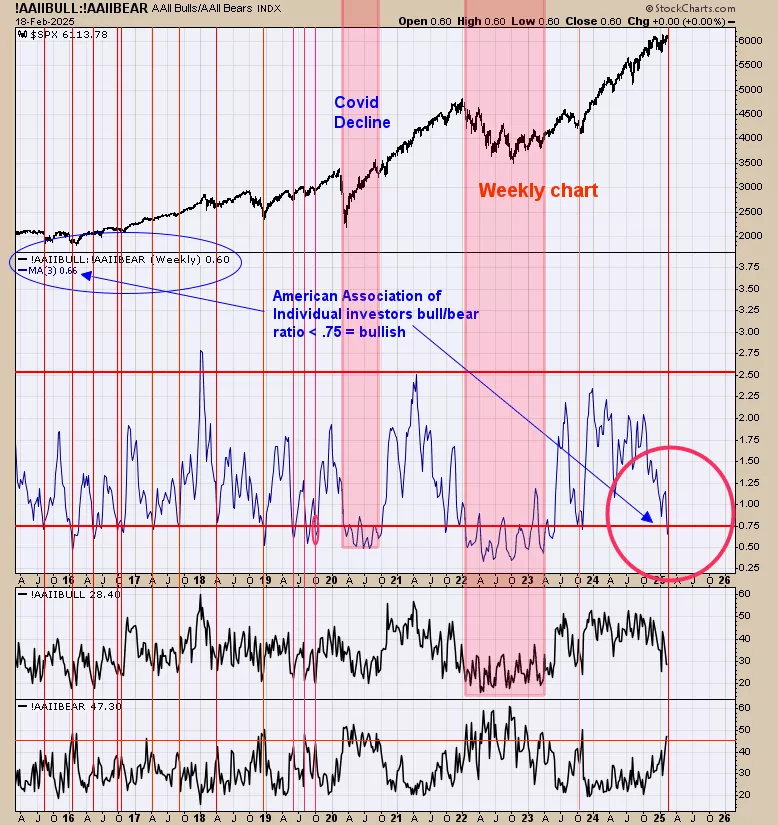
The middle window is the “American Association of Individual Investors bull/bear ratio” (AAIIBB). When this ratio falls below .75 (current reading is .66), the market is near a support area (Noted with red lines and shaded pink boxes). Market can still pull back but most of the times the pull back are mild (2022 was anomaly). This indicator gives support to the limited pull back to the gap near 585 SPY.
(Click on image to enlarge)
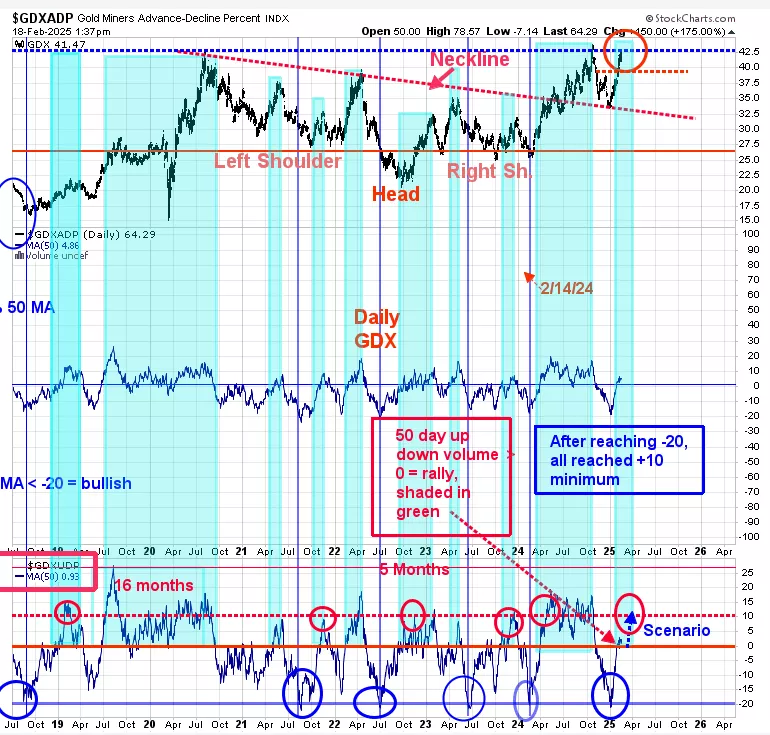
Chart above has been updated to today’s trading; yesterday’s commentary still stands, “The bottom window is the 50 day average of the up down volume for GDX. When the 50 day average of the “up down volume” reaches below -20 (circled in blue), all rally to +10 at a minimum (circled in red). Most took 6 months for the “up down volume” to go from -20 to +10.For the current condition the “up down volume” hit -20 in early January and add 6 months to January would come up with July period where this indicator may hit +10 range or higher. For this indictor to reach +10, GDX would have to continue to rally. Normally when “up down Volume” closes above “0” (Today’s price +.93; shaded in light green) an intermediate term rally is starting”. Added to above;Short term consolidation is possible finding support tern the previous high of 39.00 (noted on chart with red dotted line).
More By This Author:
Seasonality Has Turned Bullish
Rally Starting Soon
“Zweig Breath Thrust indicator”
Signals are provided as general information only and are not investment recommendations. You are responsible for your own investment decisions. Past performance does not guarantee future performance. ...
more

