
SPX Monitoring purposes; Long SPX on 2/25/25 at 5955.25.
Our gain 1/1/24 to 12/31/24 = 29.28%; SPX gain 23.67%
Our Gain 1/1/23 to 12/31/23 SPX= 28.12%; SPX gain 23.38%
Monitoring purposes GOLD:Long GDX on 10/9/20 at 40.78.
We ended up 29.28% for 2024; SPX up 23.67% for the year. Last Thursday we said,
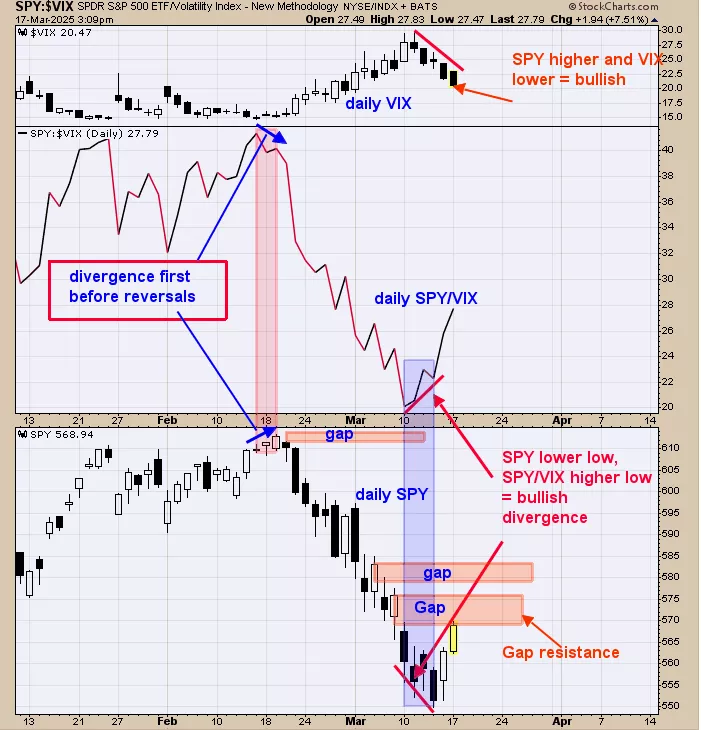
“The bottom window is the daily SPY and next higher window is the daily SPY/VIX ratio. A bullish divergence occurs when the SPY makes a lower low and the SPY/VIX makes a higher low; this bullish divergence is noted on the SPY chart above suggesting the SPY near a low. (Noted in blue)”.
We also noted that last Thursday that the weekly SPY open and close where below the lower Bollinger bands predicting multi week rally. It appears a low (worst case a test of the low) is in and a multi week rally is staring.
(Click on image to enlarge)
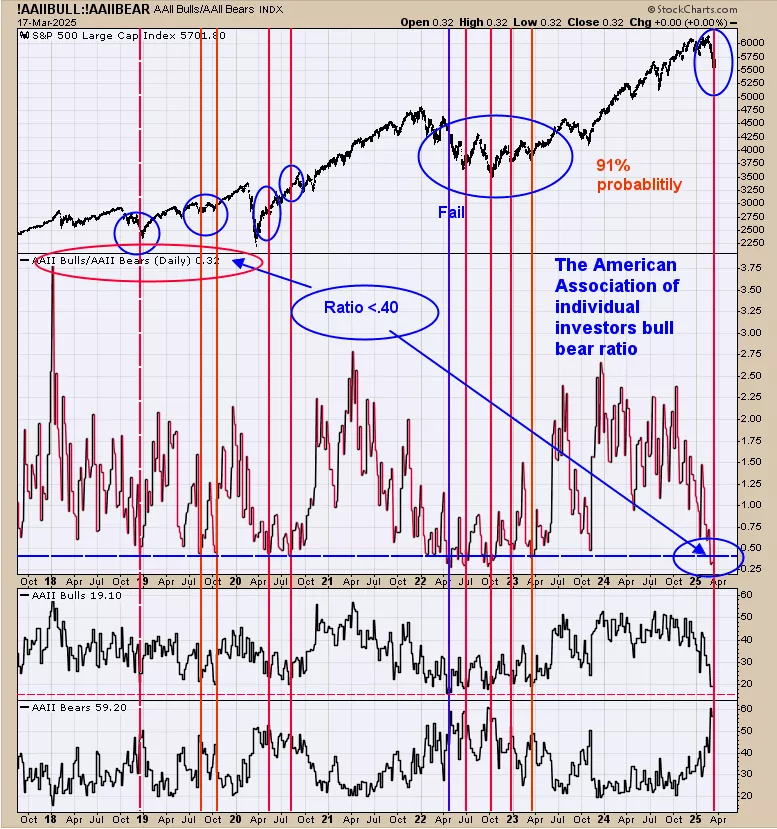
The middle window is “The American Association of individual Investors bull bear ratio” (AAIIBB). Chart goes back to 2017 and shows the times when AAIIBB reached .40 and lower (current reading is .32). There where eleven times AAIIBB reached .40 and lower go to mid 2017 and there was one failure for the market to rally around April 2022 (noted in blue) which works out to 91% success rate. This indicator predicts the market will rally for multi weeks or longer.
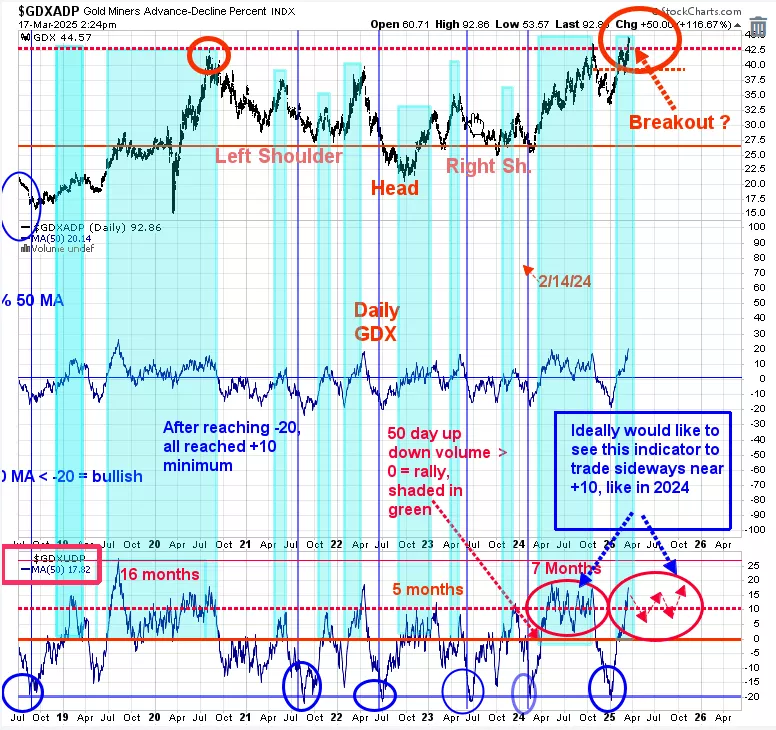
The bottom window is the daily GDX 50 day average of the up down volume. This indicator is a momentum indicator; as long as this indicator stays above “0”, GDX is considered in an uptrend. We shaded in green the times when this indicator has been above “0” and in turn shows that GDX was rallying. Currently this indicator is at +17.82 and bullish. The top window is GDX and it appears to be break above its previous highs near 43.00 range and could be “Breaking out”. We noted on the chart that the pattern forming on GDX (going back to 2020) appears to be a Head and Shoulders pattern. Measuring from bottom of the Head to the Neckline is 22 GDX points; add that to the Neckline is a projection near 65.00 for a possible upside target. Going through the Neckline (which GDX is at now) will require a “Sign of Strength” suggesting the current rally may get stronger.
More By This Author:
A Low In The Market Is Near
Higher Volatility Is Nearing
Seasonality Has Turned Bullish


Comments
Log in or sign up to join the conversation.