The Current State Of Global Liquidity And Bank Policy Rates… Two Deflationary Headwinds
Image Source: Unsplash
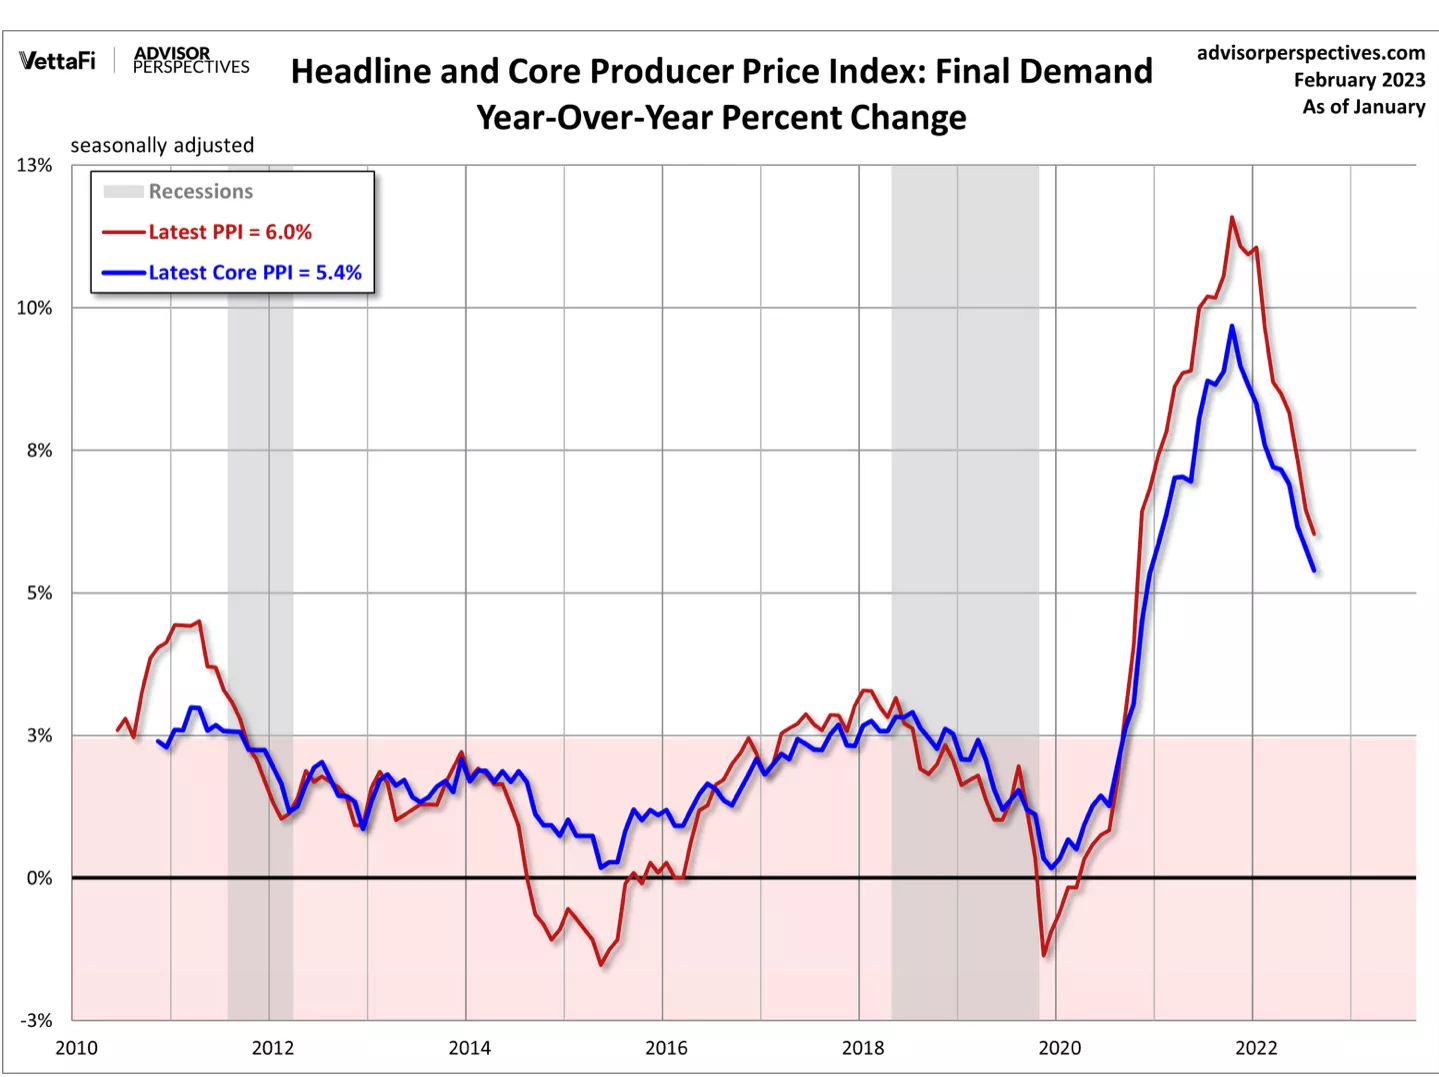
The CPI is higher than both its 10-year moving average, which is now 2.52%, and the average of 3.74% since the end of World War II.
(Click on image to enlarge)

This is important to keep in mind because, by some metrics, the tightening of financial conditions globally has only just begun.
The most significant short- and medium-term driver of risk assets is certainly liquidity.
In the absence of liquidity, an asset's inherent worth is irrelevant.
A move higher in liquidity may have already occurred after declining for more than a year, but it appears too soon to declare the situation resolved.
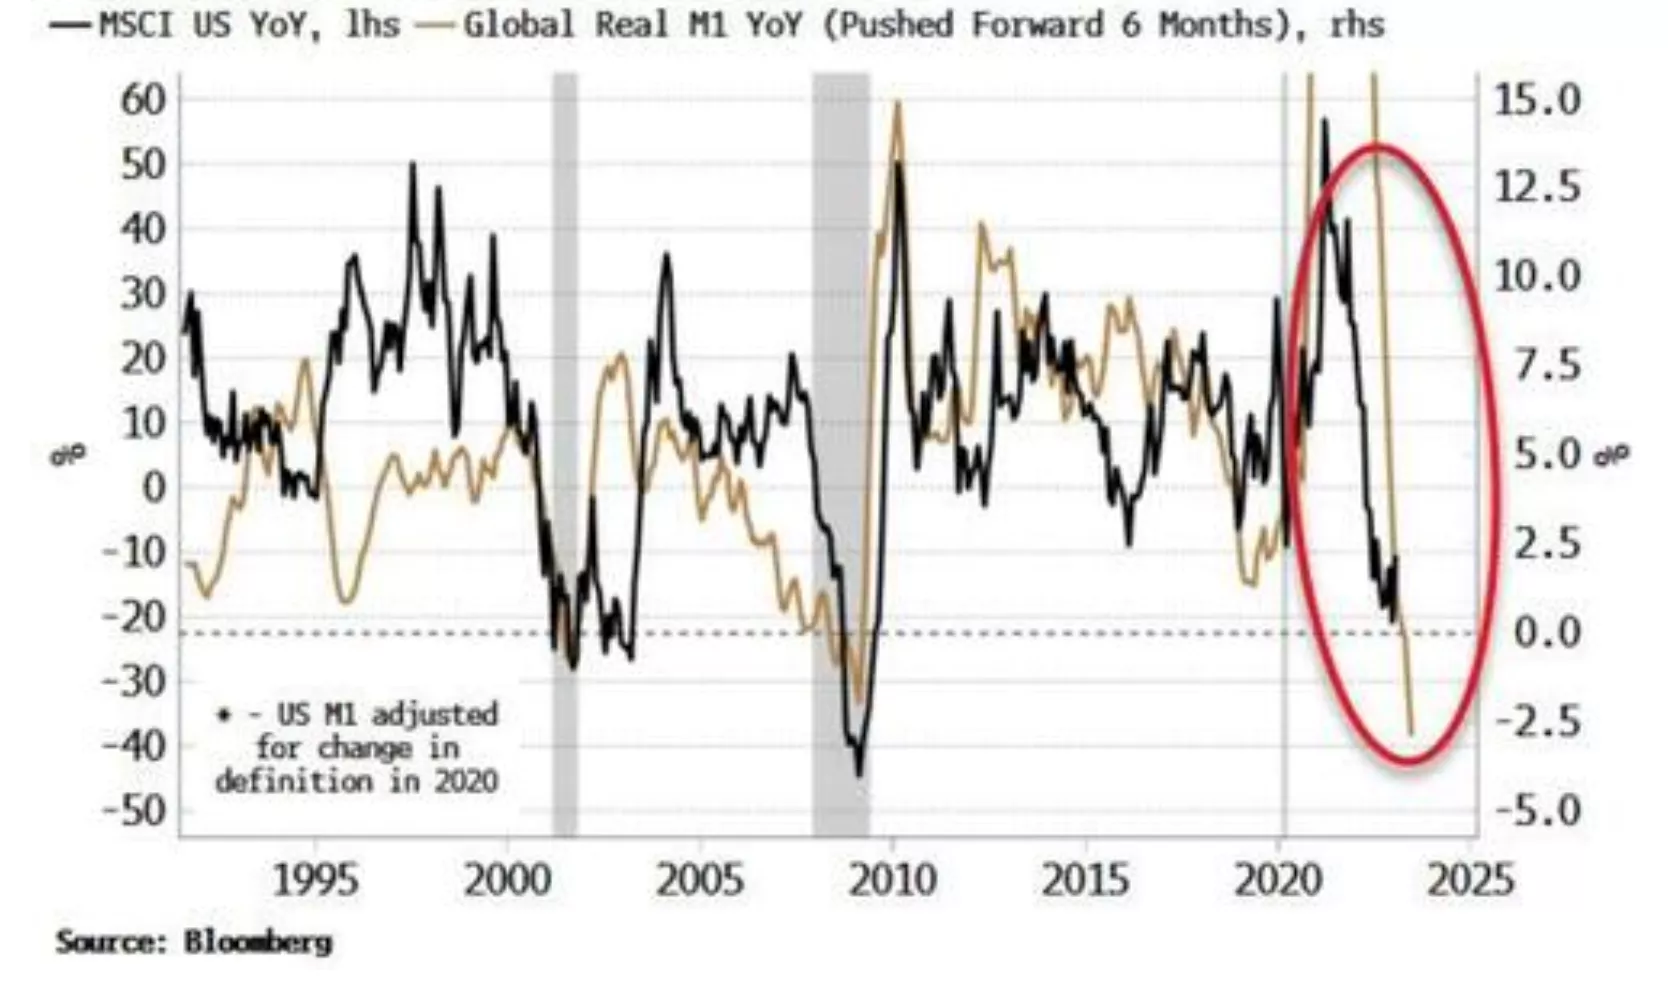
The annual growth in real M1 is one of the simplest indicators of liquidity that accomplishes this.
(Click on image to enlarge)

Compared to M2, M1, which increases when a bank generates the demand deposit that serves as the counterpart to a new loan, is a much stronger indicator of future activity.
Real M1 globally, or real M1 of the G10, is still quite depressed and is still declining from the peak it reached following the unprecedented easing measures during the epidemic.
According to the graph below, American equities prices lag behind worldwide actual M1 by around nine months. A turnaround has not yet been indicated.
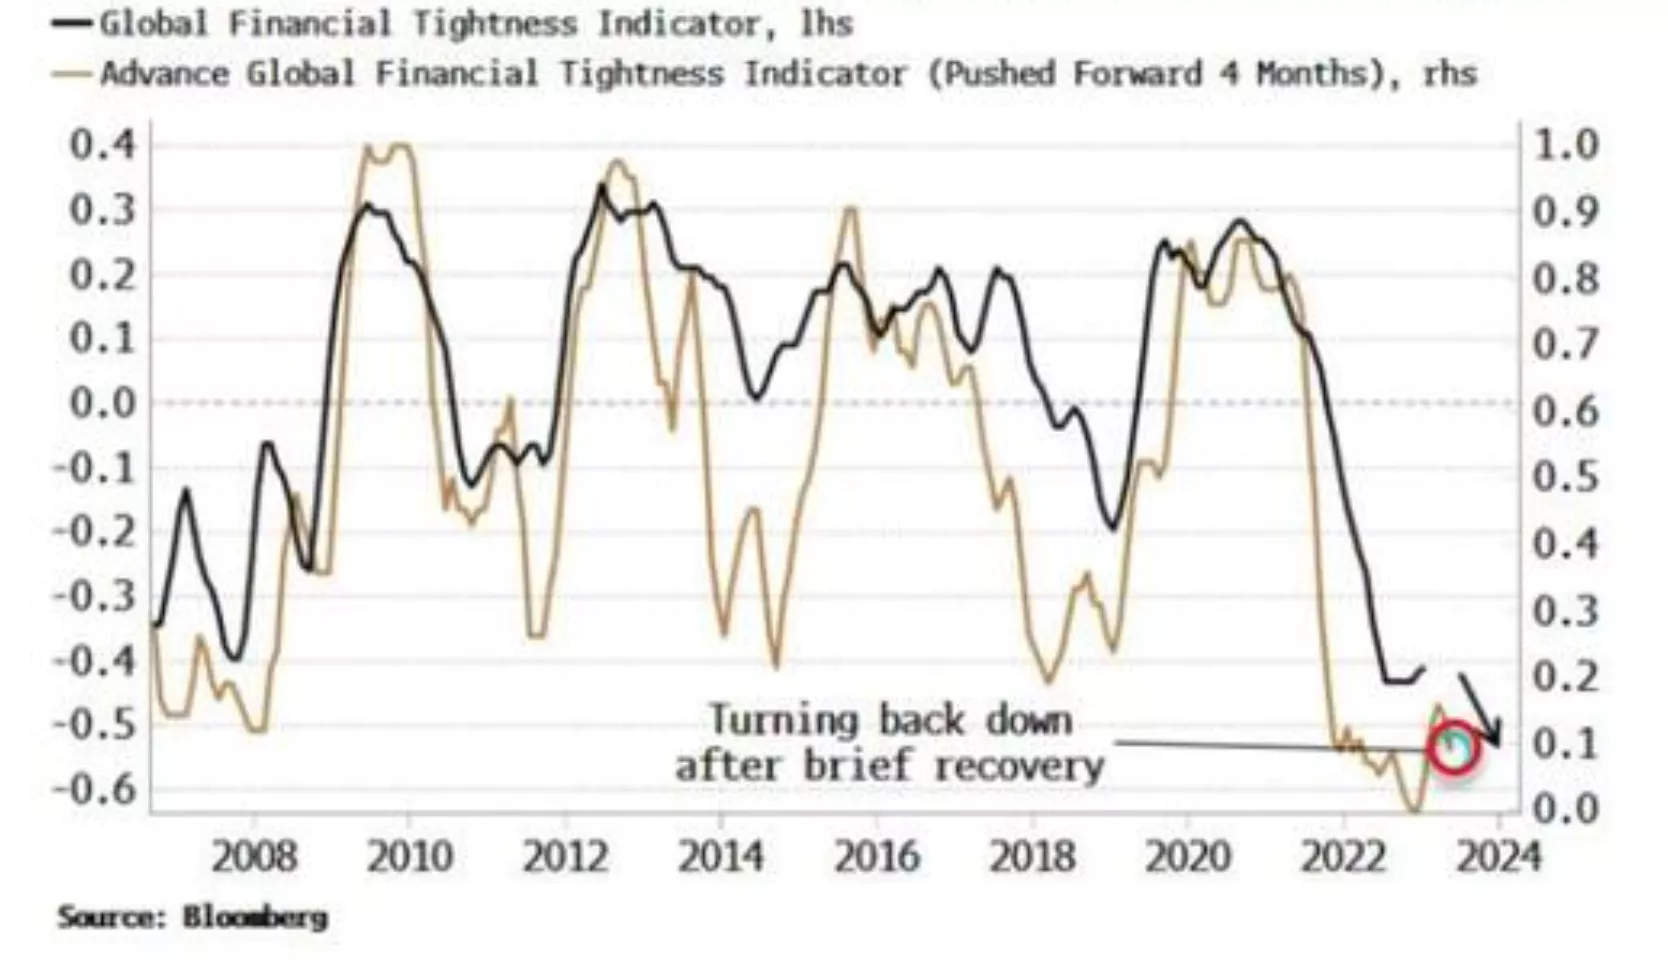
A "quantity" perspective of liquidity is real M1 growth. Liquidity as seen from a "price" perspective conveys the same idea.
The GFTI is currently growing, but the Advanced Global Financial Tightness Indicator (AGFTI), which predicted that it would soon start rising, is now declining.
(Click on image to enlarge)

Another instance of liquidity-enhancing assets has been described as the Treasury drawing down its account with the Fed (the TGA).
The "anything rally" was fueled by a TGA reduction of over $1.5 trillion in 2021, which increased bank reserves and supported asset prices.
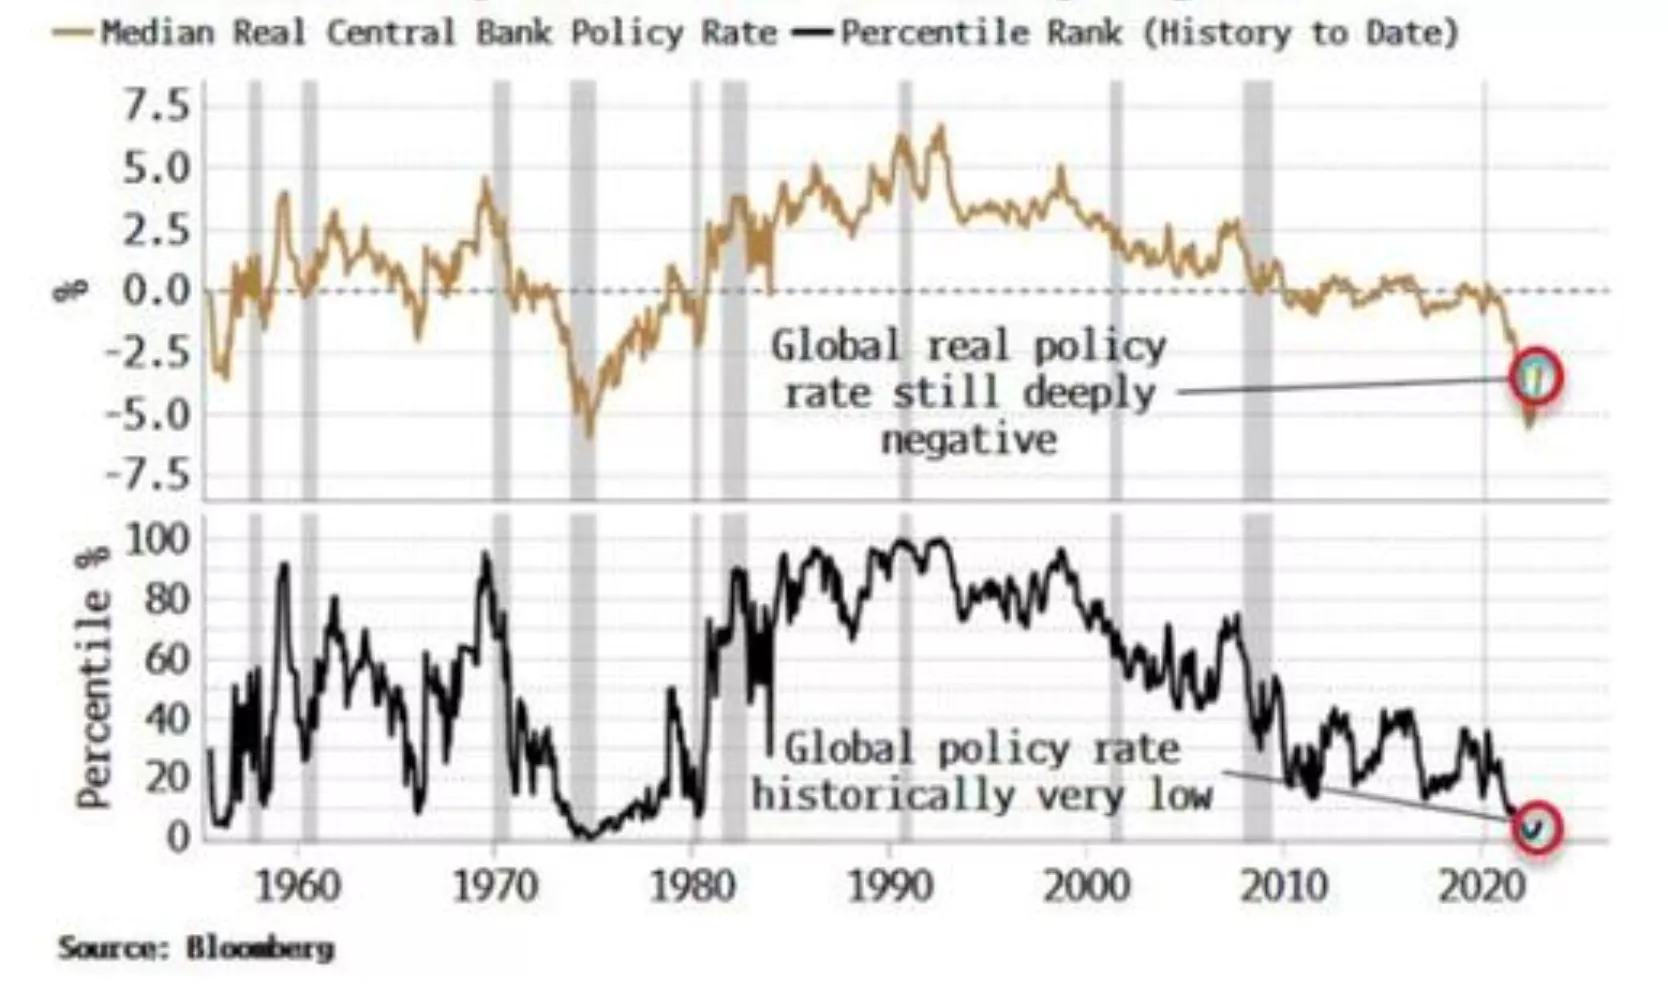
In reality, after rebounding from its recent lows of -3% to close to all-time lows of -5.5%, the median global real central-bank policy rate nevertheless remains sharply negative.
It is still in the bottom 6% of all readings going back to the middle of the 1950s.
(Click on image to enlarge)

More By This Author:
From An Annualized Peak Of 9.1% Last Summer, Inflation Has Dropped
Deflation Has Begun
Expect Equities To Improve Before The Economy In 2023
Disclaimer: These illustrations are not a solicitation to buy or sell any ETF. I am not an investment advisor/broker


