AUD/USD Forex Signal - Bearish Flag Pattern Points To More Downside
Bearish View
- Sell the AUD/USD pair and set a take-profit at 0.6645.
- Add a stop-loss at 0.6780.
- Timeline: 1-2 days.
Bullish View
- Set a buy-stop at 0.6730 and a take-profit at 0.6800.
- Add a stop-loss at 0.6645.
(Click on image to enlarge)
The AUD/USD pair was in a tight range on Tuesday morning and was hovering near its lowest point since September 16. It has plunged by more than 3.20% from its highest level this year.
China Stimulus Hopes
The AUD/USD exchange rate retreated after China published the latest trade numbers. According to the country’s statistics agency, imports rose by 0.3% in September after rising by 0.5% in the previous month. The increase was lower than the median estimate of 0.9%.
Exports, on the other hand, rose by 2.4% on a year-on-year basis, lower than the median estimate of 6.0%. The increase was also lower than August’s increase of 8.7%, while the trade surplus waned to $81.7 billion.
As a result, China’s government announced measures to boost the economy. In a statement, the finance ministry said that it was prepared to deliver more stimulus, including by widening the budget deficit. Some of these funds will move towards the ailing property sector.
The new pledge came a few months after the government and the central bank unveiled more measures that will unlock billions of dollars in funds.
Analysts expect that these measures will boost the economy. In a note, analysts at Goldman Sachs upgraded the GDP forecast from 4.9% to 4.7%, and its 2025 estimate to 4.7%.
A stronger Chinese economy is a good thing for Australia because of the volume of goods it sells to the country. Some of these exports are commodities like coal, iron ore, gold, and petroleum gas.
There will be no important economic data from the US and Australia on Tuesday. Therefore, traders will focus on the upcoming US retail sales numbers and statements by Fed officials like Fed officials like Adriana Kugler.
AUD/USD Technical Analysis
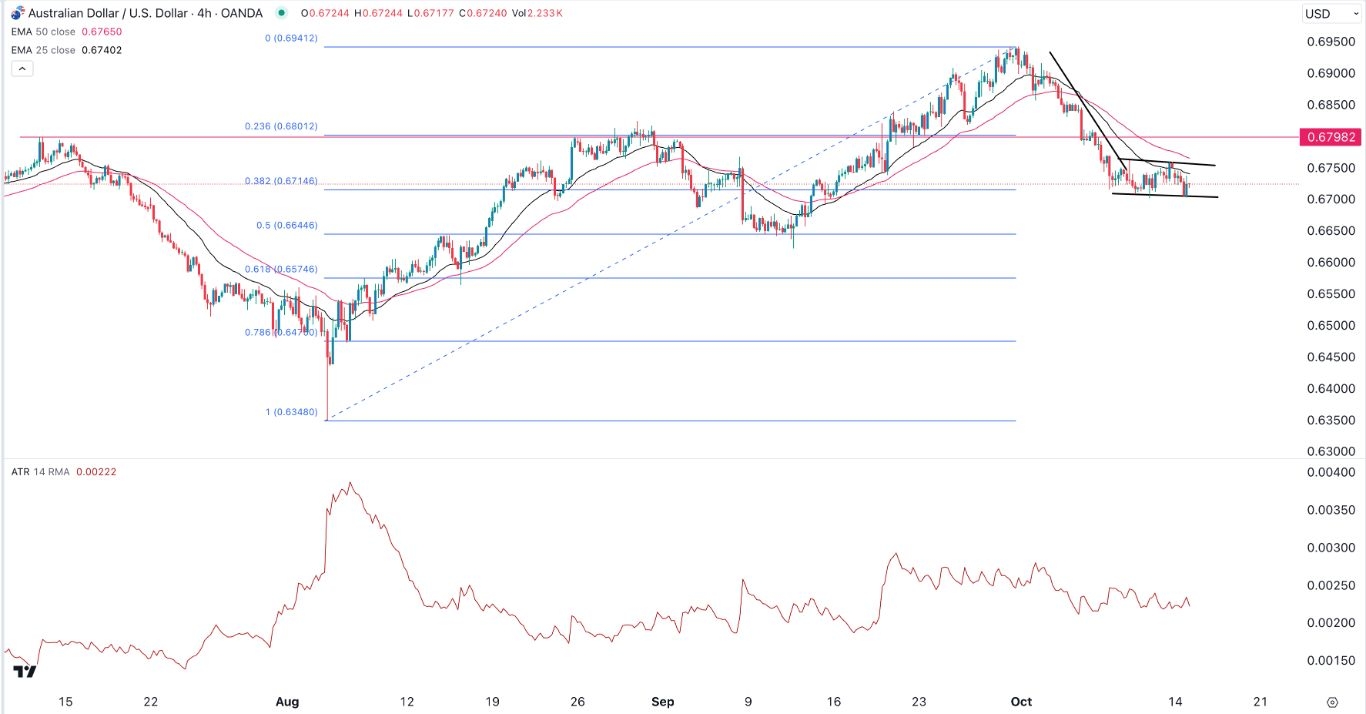
The 4H chart shows that the AUD/USD exchange pair rate has moved sideways in the past few days. It has moved below the 23.6% Fibonacci Retracement point.
The pair has also moved below the 50-period and 25-period Exponential Moving Averages (EMA). It has formed a bearish flag chart pattern, a popular negative sign.
The Average True Range (ATR) has moved sideways, signaling that it has minimal volatility. Therefore, the pair will likely have a bearish breakout in the next few days. If this happens, the next point to watch will be the 50% retracement point at 0.6645.
More By This Author:
BTC/USD Forex Signal. Inverse Head And Shoulders FormsBTC/USD Forex Signal: Bitcoin Gains Could Be Short-Lived
AUD/USD Forex Signal: US Dollar Makes A Comeback
Disclosure: DailyForex will not be held liable for any loss or damage resulting from reliance on the information contained within this website including market news, analysis, trading signals ...
more


