BTC/USD Forex Signal. Inverse Head And Shoulders Forms
Bullish View
- Buy the BTC/USD pair and set a take-profit at 70,000.
- Add a stop-loss at 62,000.
- Timeline: 1-2 days.
Bearish View
- Sell the BTC/USD pair and set a take-profit at 60,000.
- Add a stop-loss at 70,000.
(Click on image to enlarge)
Bitcoin price drifted upwards, reaching a high of $65,840, its highest point since July 31st. The BTC/USD pair has moved into a bull market, rising by over 33% from its lowest level in August.
This rebound mirrored the performance of other assets like stocks and commodities. The Dow Jones index rose by 240 points, while the Nasdaq 100 and the S&P 500 indices rose by 0.90% and 0.87%.
The main catalyst for the price action was the decision by China to announce another series of stimulus package. While the dollar figure of the deal was not mentioned, analysts expect that it will lead to will boost the economy.
Bitcoin has also seen strong inflows in the ETF market. Data shows that these funds have added over $300 million in the last six days, bringing the total inflows this year to over $18.8 billion.
Looking ahead, Bitcoin will likely react to the ongoing quarterly earnings season. Some of the top companies to watch will be big banks like Bank of America, Goldman Sachs, Charles Schwab, and Citigroup. In the past, these results tend to have an impact on Bitcoin and other assets like equities.
BTC/USD Technical Analysis
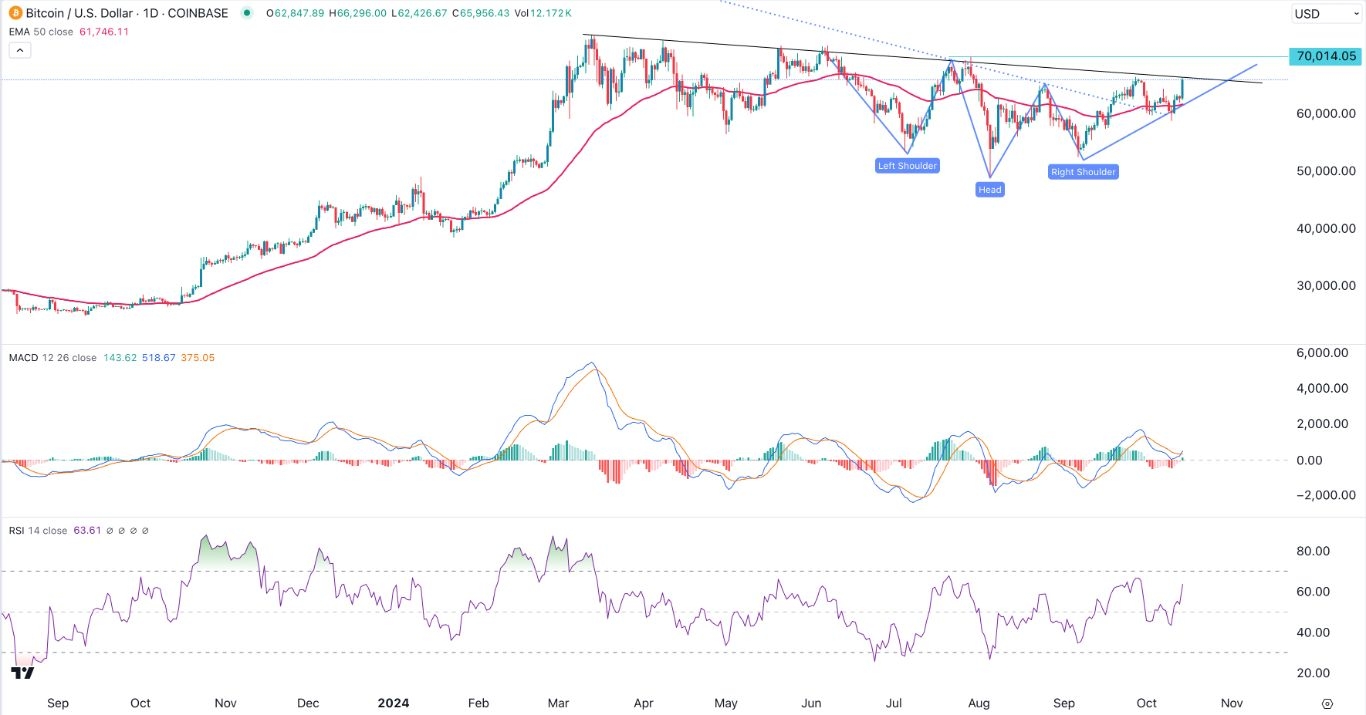
The BTC/USD pair has been in a tight range in the past few weeks. It rose to a high of 66,000, an important resistance point.
Bitcoin has risen above the 50-day and 200-day Exponential Moving Averages (EMA), meaning that bulls are in control.
The pair has also formed an inverse head and shoulders pattern, which is often a bullish sign in the market.
Also, the Relative Strength Index (RSI) has drifted upwards, moving above the neutral point of 50. The two lines of the MACD have formed a bullish crossover pattern.
Bitcoin is attempting to pierce the descending trendline, which connects the highest swings since March.
Therefore, the BTC/USD pair will likely have a bullish breakout, with the next point to watch being the resistance point at 70,000, its highest swing on July 29. More sustained gains will be confirmed if it rises above the all-time high of 73,800. On the flip side, a drop below the support at 62,500 will point to more downside.
More By This Author:
BTC/USD Forex Signal: Bitcoin Gains Could Be Short-LivedAUD/USD Forex Signal: US Dollar Makes A Comeback
AMD Stock Price Could Surge By 33%, But Oct. 29 Will Be Crucial
Disclosure: DailyForex will not be held liable for any loss or damage resulting from reliance on the information contained within this website including market news, analysis, trading signals ...
more


