
XAU Has Likely Broken Out To The Upside

Image Source: Pixabay
I regularly review my earlier analysis and comments.
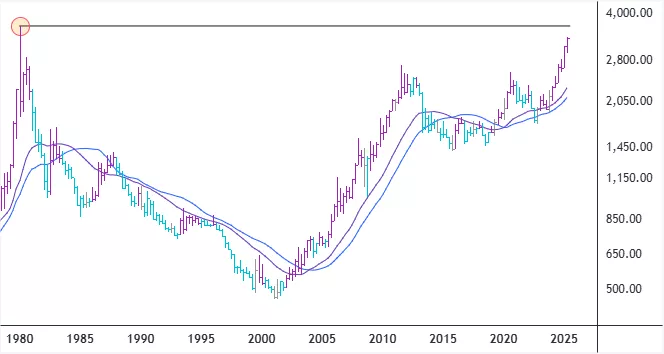
In a prior article, I discussed the spot price of physical gold and the Philadelphia Gold and Silver Sector Index (XAU). As I expected, gold´s price has indeed surged higher with the collapse seen in the equity market. The inflation-adjusted price of gold is approaching its all-time intraday high from the year 1980.
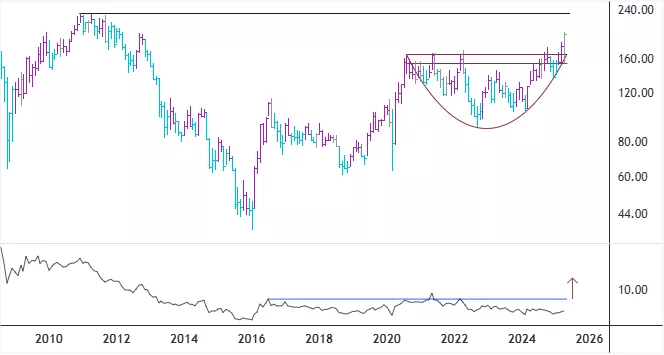
Also, seemingly, the XAU has broken out to the upside (must stay above the 154 level), so I am anticipating higher index levels. However, I am still waiting for its ratio to gold´s price to rise above the 8.2% mark. That would be the first indication of the share prices of gold and silver miners beginning to catch up with and outperform the price of their underlying yellow metal.
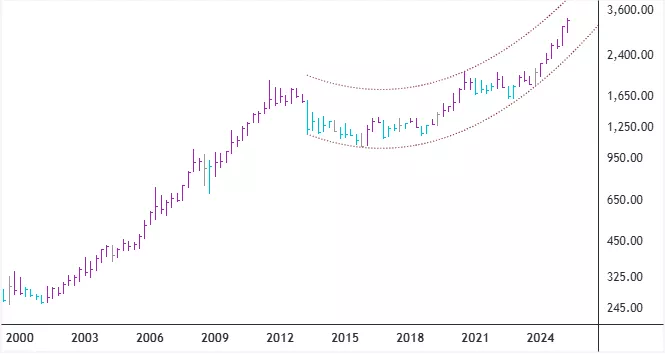
Price of Gold – Quarterly Chart
Gold´s Inflation Adjusted Price – Quarterly Chart
XAU – Monthly Chart
See my prior article here:
Inflation-Adjusted Gold Price Nearing $3000 | TalkMarkets
I also urge readers to examine my previously posted articles related to the price of gold, as listed below in chronological order, and compare what I said then to what has taken place since:
Tech Giant Stock Prices Versus Gold´s Price At Critical Inflection Point | TalkMarkets
Nasdaq 100 Indices Vs. Gold Price At Critical Point | TalkMarkets
Promising Long-Term Gold Price Formations | TalkMarkets
Is Gold Price Ready To Take Off? | TalkMarkets
More By This Author:
Leadership And Breadth In The U.S. Equity Market
Financial Sector At Important Inflection Point
Inflation-Adjusted Gold Price Nearing $3000
Disclosure: The author of the analysis presented does not own shares or have a position or other direct or indirect monetary interests in the financial instrument or product discussed in his ...
more

