
Inflation-Adjusted Gold Price Nearing $3000

Image Source: Pixabay
The price of gold in U.S. dollars, adjusted for U.S. inflation (using the January 2025 CPI as the latest figure), has risen above its 2011 and 2020 swing highs.
Price of Gold – Quarterly Chart

I think gold´s price will surge if the U.S. stock market, especially the price of key technology stocks, starts to decline dramatically. In that scenario, capital might rotate out of equities and into gold, silver and gold and silver miners – even U.S. treasury bonds.
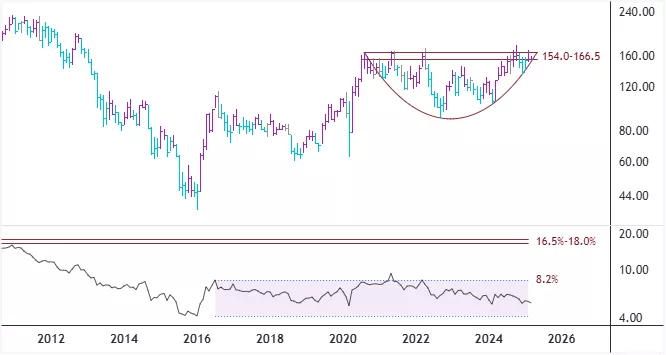
The chart below shows the Philadelphia Gold and Silver Sector Index (XAU). In the lower window is its proportion or ratio to the spot price of gold, where the Index level is expressed as a percentage of gold´s price for a nicer number. The ratio represents the relative performance between the two.
As can be seen, the XAU has formed a type of cup-and-handle pattern and the Index needs to rise convincingly above the 166.5 level and stay there-above to confirm that much higher levels are likely to come.
In December 2015, the ratio reached its historical low as both the XAU Index and the price of gold made their lows at the same time. Since then, the ratio has moved sideways in a range. If the share prices of tech companies in the U.S., reflected for instance in the Nasdaq 100 Index, begin to fall sharply, then I believe the prices of gold/silver mining company stocks and silver could advance much more than gold´s price – thus outperforming the yellow metal itself. Then the XAU/Gold ratio may rise to the 16.5% to 18.0% area marked on the chart.
XAU Index - Monthly Chart
More By This Author:
Share Price Of Kvika Banki At An Important Conjuncture
Tech Giant Stock Prices Versus Gold´s Price At Critical Inflection Point
Potential Upside Targets For Iceland´s Equity Market Indices
Disclosure: The author of the analysis presented does not own shares or have a position or other direct or indirect monetary interests in the financial instrument or product discussed in his ...
more

