

Image Source: Pexels
I urge readers to review my recent articles to see how they warned about the underlying weaknesses in the U.S. stock market.
The topic of this article is the difference between the concepts of market leadership and market breadth. They do not mean the same and seemingly, many confuse and misunderstand the two.
Market Leadership
Throughout a long-advancing market, it is common to hear business media talk about leadership being narrow and an imminent major market top is approaching. One must realize that leadership, by definition, is always narrow. On a basketball team, the best players often score the most points and make the most assists in games; they outperform their more average-skilled teammates in those categories and stand out from others, they lead the team.
Similarly, the best company stocks in a market attract the most attention and demand from buyers and tend to do better than other stocks and the market indices. The stock leadership of large, fast-growing companies, whether we call the group the Fab-5, Magnificent Seven, FAANG, etc., does not necessarily have a negative implication for the broad market. The stock market, just like companies or sports teams, needs leaders.
We could view the relative strength of the best-performing stocks as a natural by-product of investors seeking excess returns. It is also quite normal to see investment capital flock or flow into the “safety” of such stocks in the later stages of an extended and mature bullish market – perhaps when it is increasingly perceived as being expensive or overvalued – which then pushes up their share prices as investors look for shelter if forthcoming headwind or storm may be on the horizon.
Market Breadth
Breadth measures the participation of individual stocks in index moves. It is a gauge of “market internals”, i.e., how many stocks are actively participating in a directional move. The stock market is considered healthy overall when the uptrend and new highs in indices are matched by a similar uptrend and new highs in breadth indicators. In a healthy market, most stocks are advancing in alignment with the indices. New highs in the S&P 500 and other indexes are confirmed or led by new highs in breadth metrics. That is a sign of internal market health. It reflects broad-based demand from buyers. The soldiers (the smaller-cap stocks) follow the generals (the larger-cap stocks) and they march together in the same direction. A large force (troop) of rising stocks forms a more durable advance compared to an advance made up of a much smaller group of rising stocks.
If, however, the top performers are the only stocks doing well for a sustained period, then that would be a market breadth problem. In other words, when the share prices of a handful of large, favored companies are still rising toward the end of a bull market, while prices of other stocks have stalled or begun to decline, the exceptional performance of the relatively few stocks masks or obfuscates what is happening below the surface.
Most major equity market indices are weighted by the market capitalization of the constituent company stocks. That means large-cap stocks have the greatest weight and thus most influence on index movements. But not all stocks belong to mega- or large-cap companies. Most do not. Therefore, one should view the stock market as a market of individual stocks. The parts make up the whole, not the other way around. Examining solely moves in index levels can sometimes be very misleading.
Typically, the indexes continue to advance – driven or led by the attractive big market-cap stocks – but without many of their smaller counterparts. The general market becomes bifurcated, meaning a divergence between the performance of big stock names and smaller, lesser-known stocks takes place with the former group of stocks distorting the performance of the indexes. The two groups, that commonly move together in a strong market, start to move in opposite directions; the few larger-cap stocks continue to surge ahead while the smaller-cap stocks get left behind.
Carrying on with my basketball analogy, just like LeBron James is only capable of carrying the LA Lakers team on his shoulders for a few games (he is human after all), the share prices of the key stocks can only hold up the market indexes for a set amount of time. It becomes more and more difficult for the prices to keep on rising and eventually, the time comes when they start to roll over as well, usually causing sharp declines in the major indices. As the saying goes, the generals are shot last.
One can use specific breadth indicators like the A-D line to identify and monitor when a market index advance is becoming less consistent and narrower. Usually, and fortunately, the narrowing in market participation – with fewer and fewer stocks taking part in the up move –occurs well before the index top and is manifested in non-confirmation between the market price indexes and the breadth measures.
I was asked the other day when the U.S. stock market reached its top before collapsing. Well, it depends on which index one uses. The Nasdaq Composite topped out on the 16th of December 2024 and the S&P 500 index on the 19th of February 2025. Both are market-cap-weighted indices.
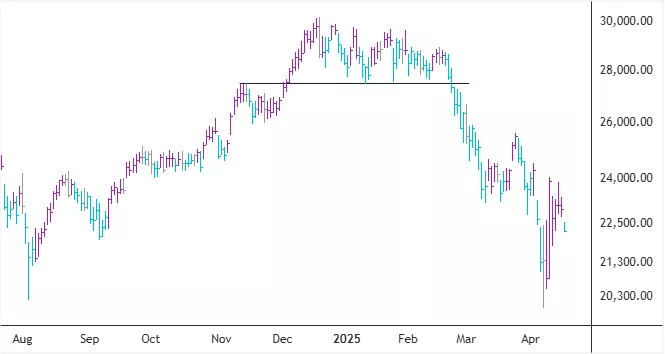
I prefer to use equal-weighted indexes as a type of breadth metric. The two Value Line indices saw their peaks on November 25th, 2024. They include the same stocks but use different averages in their calculation. The arithmetic version tracks the performance of the mean stock in the index, while the geometric type tracks the performance of the median stock.
I created an equal-weight geometric average of the Magnificent Seven stocks. It peaked on December 17th, 2024.
Value Line Geometric Index – Daily Chart
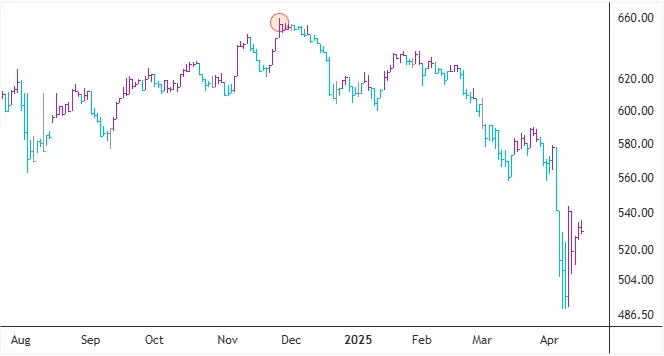
Mag-7 Equal Weight Geometric Average – Daily Chart
More By This Author:
Financial Sector At Important Inflection Point
Inflation-Adjusted Gold Price Nearing $3000
Share Price Of Kvika Banki At An Important Conjuncture

Comments
Log in or sign up to join the conversation.