

Image Source: Pixabay
Market Brief – “When Doves Fly.”
The Federal Reserve’s FOMC meeting this past week delivered a deeply dovish outcome for markets. The FOMC cut the federal funds rate by 25 basis points to a range of 3.50% to 3.75%. This marks the third consecutive rate reduction this year. While the vote was 9‑3, there was notable dissent on both sides of the policy debate. Three officials opposed any change, and one called for a larger cut. While unsurprising, it underscores the internal disagreement about the direction of the economy.
However, the most striking aspect of the decision was the Fed’s shift in focus toward employment risks. During Powell’s press conference, he emphasized that job gains have slowed and downside risks to employment have increased. That statement aligns with our recent article on how alternative employment sources may affect its outlook. Powell went further, suggesting official payroll figures likely overstate job growth by around 60,000 jobs per month. That implies an actual labor market contraction. It further acknowledges that the potential negative payroll growth was a pivotal signal of the Fed’s priorities.
In another dovish surprise, the Fed announced that it will begin monthly purchases of approximately $40 billion of short-term U.S. Treasuries. These purchases are intended to manage reserve balances and ensure ample liquidity in money markets. It isn’t meant to stimulate the economy through traditional quantitative easing. Whether it’s “QE” or “Not QE” will likely be a contested debate in the coming days. Regardless, the increase in liquidity should offer support to the markets heading into next year. The purchases will start on December 12 and will remain elevated for several months to address near‑term funding pressures.
Interestingly, the Fed’s updated economic projections also reinforced the dovish tone. Committee forecasts showed:
- GDP Growth: The Fed raised its projection for 2025 GDP and increased the forecast for 2026 to approximately 2.3%. Such reflects confidence in the economy’s resilience.
- Inflation: Core PCE inflation expectations were trimmed modestly, with 2025 and 2026 core inflation estimates slightly lower. This suggests that expectations are for inflation to continue easing toward the Fed’s 2% target over time.
- Employment: Despite projecting unemployment near current levels, the Fed highlighted that labor markets are loosening. Furthermore, downside risks have increased, raising the odds that the Committee will prioritize employment stability.
The statement is interesting because it projects an increase in growth, but with slowing inflation and employment. Of course, this is also the threat from artificial intelligence. Expectations are that it will increase productivity, leading to stronger output, but also reduce costs and labor. Although that outcome will be great for corporate profitability, it is unlikely to be the outcome most Americans desire.
Nonetheless, the markets responded positively to the dovish decision, with equities rallying and yields falling. Increased demand for risk assets was supported by improving liquidity conditions.
Which brings us to the market.
Technical Backdrop – Market Rallies As Expected
The S&P 500 closed the week at 6.847, holding its bullish trend structure and briefly breaking out to new all-time highs on Thursday. After a strong rally driven by a dovish Fed, the index pushed into the previously outlined resistance range of 6850–6900. That level had previously acted as a ceiling and is now a key technical pivot. Even with the push higher, volume has been light on recent rallies, and momentum indicators, such as the RSI, suggest the rally is losing steam. However, despite ongoing concerns about mega-cap stocks, the broader uptrend remains intact.
(Click on image to enlarge)
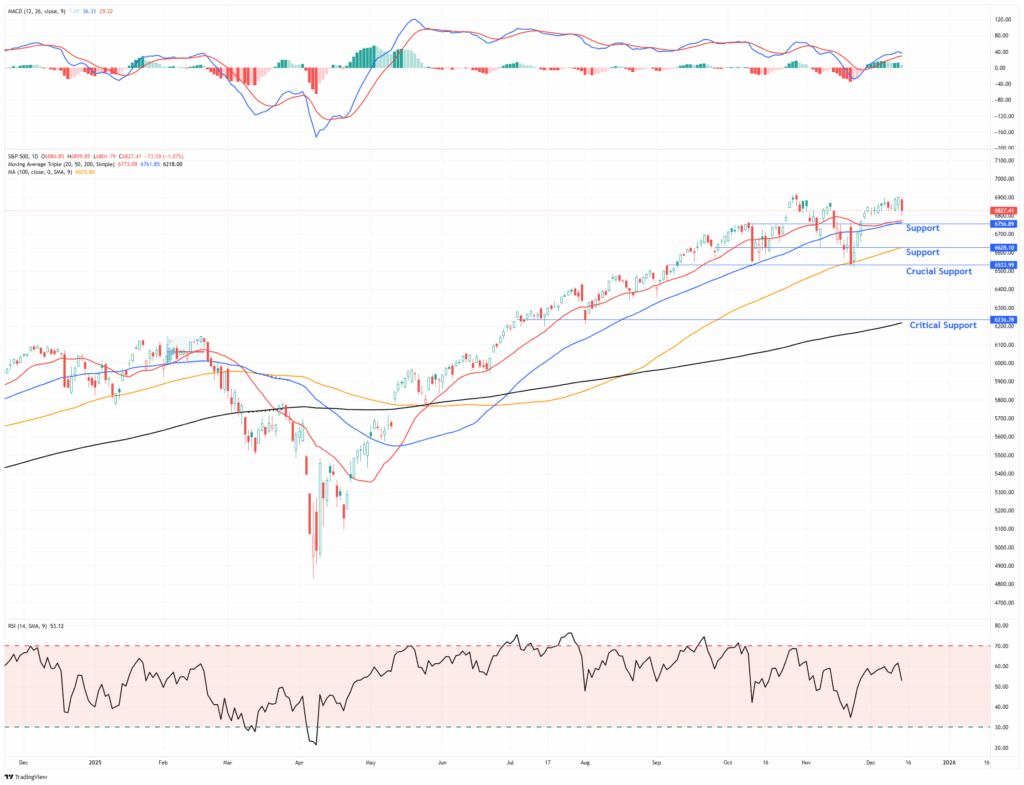
The index remains solidly above both its 50-day and 200-day moving averages. The collision of the 20- and 50-day averages, which was reclaimed following the October correction, now serves as immediate support. Should the market lose this area, the next crucial demand zone sits near 6,635, which is the 100-day moving average. Just below that level is “crucial support” at the 100-day moving average. That level marks the bottom of the November retracement and will be critical to watch if downside pressure builds. A more pronounced decline would bring the 200-day moving average, now near 6,236, into play, and would represent a significant shift in market character if it were tested.
On the upside, bulls need a clear break and close above 6,901 to confirm the recent breakout to new highs. If they succeed, the next resistance zone lies between 7,070 and 7,100, which is the top of the current trend channel. That is where markets would become increasingly deviated from their longer-term means. For now, the market is likely to remain range-bound until the year-end push following the Christmas holiday.
Key Technical Levels
Resistance:
- 6,850–6,900 (Current ceiling)
- 7070–7100 (Top of trend channel)
Support:
- 6,756 (50-day moving average zone)
- 6,628 (100-day moving average.
- 6,533 (November correction lows.
- 6,236 (200-day moving average)
Next week, focus will shift to whether the bulls can sustain momentum into year-end. Markets are entering a seasonal window where fund flows, tax positioning, and institutional rebalancing typically drive short-term direction. Watch for confirmation of a breakout above 6,900, accompanied by rising volume. If the price fails to hold above support at 6,756, it may trigger a deeper test toward the November lows, but this seems to be a lower-probability event currently. Sideways consolidation is the base case unless new catalysts emerge.
Key Catalysts Next Week
Market participants enter the week with several critical macroeconomic releases and a modest earnings slate that could drive volatility as year‑end positioning accelerates. The week begins with regional manufacturing data overseas that influences global sentiment, but U.S. economic indicators gain focus from Tuesday onward. Mid-week labor and retail figures may impact the narrative on growth and consumer strength, especially following the recent dovish Federal Reserve communications. Thursday’s U.S. inflation data, a key gauge for the Fed’s policy outlook following its December rate cut, will likely be the most-watched release for fixed income and equities. Housing and consumer sentiment figures on Friday will round out the week, providing additional insights into the resilience of consumer spending.

Need Help With Your Investing Strategy?
Are you looking for comprehensive financial, insurance, and estate planning services? Need a risk-managed portfolio management strategy to grow and protect your savings? Whatever your needs are, we are here to help.
The “Double Bubble”.
This weekend, global investors are reckoning with a stark warning from the Bank for International Settlements (BIS). In its December 2025 Quarterly Review, the BIS flagged what it called a rare “double bubble” forming across both gold and equity markets. According to the report, “the combination of gold and share prices soaring in unison is a phenomenon not seen in at least half a century.” In fact, BIS Economic Adviser Hyun Song Shin put the risk clearly: “Gold has behaved very differently this year compared to its usual pattern. The interesting phenomenon this time has been that gold has become much more like a speculative asset.”
The data also reflects the increased risk in both asset classes. Gold has jumped about 60 percent in 2025, its strongest annual performance since 1979. At the same time, U.S. equities, led by tech and AI‑related names, have pushed major indexes to record highs as investors chase yield, growth, and momentum. Notably, the backdrop for today’s conversation is that, starting in October 2022, both stocks and gold began a parabolic ascent, breaking from their previous growth trendlines.
That is not a fundamentally driven move; that is solely speculation. As noted in the BIS report, for the first time in over 50 years, both gold and equities have shown “explosive behavior” simultaneously.
(Click on image to enlarge)
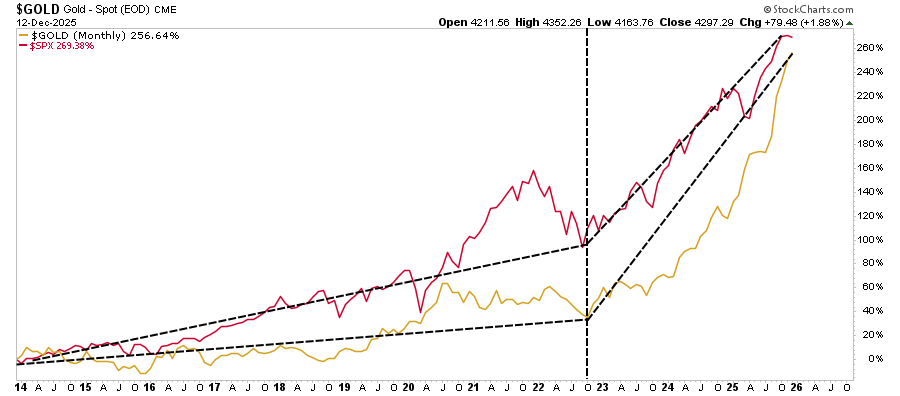
In prior episodes, such explosive behavior occurred separately. For example, gold saw a steep bubble in the late 1970s, culminating around 1980 during a period of high inflation. In that episode, gold peaked, then collapsed and spent decades losing relevance as a mainstream asset, illustrating the fleeting nature of speculative gold booms. On the equity side, previous bubbles, such as the late 1990s technology stock run-up, ended in sharp corrections when speculative exuberance outpaced fundamentals. Because the last time both markets were “bubbly” at once was over a half‑century ago, the BIS lacks a recent precedent for what could happen. The concern, however, is rather simplistic:
“If history repeats itself, overvaluation followed by reversion, investors could suffer steep losses in both their equity and gold holdings simultaneously, eliminating the traditional diversification benefit of holding both.”
I would read that again.
While the underlying drivers of the “double bubble” are multiple, this does not equate to a “this time is different” scenario. For example, while it is true that central banks have increased their purchases of bullion at a rate of approximately 1% annually over the last five years, these purchases are insignificant in terms of overall price appreciation. However, it has been retail investors, speculators, and professionals, drawn in by momentum, that have pushed gold prices sharply higher. That momentum chase, ETF inflows, and media coverage have caused investment dollars to flood into both gold and equity funds. As the BIS stated, ETF prices trading consistently above net asset value (NAV) is a clear sign of “strong buying pressure coupled with impediments to arbitrage”.
(Click on image to enlarge)

The result is a market environment where traditional relationships between risk and haven, growth and refuge, appear broken. As the BIS notes, the most significant risk of the “Double Bubble” is that what seems to be diversification may actually be concentrated risk.
Why This Matters
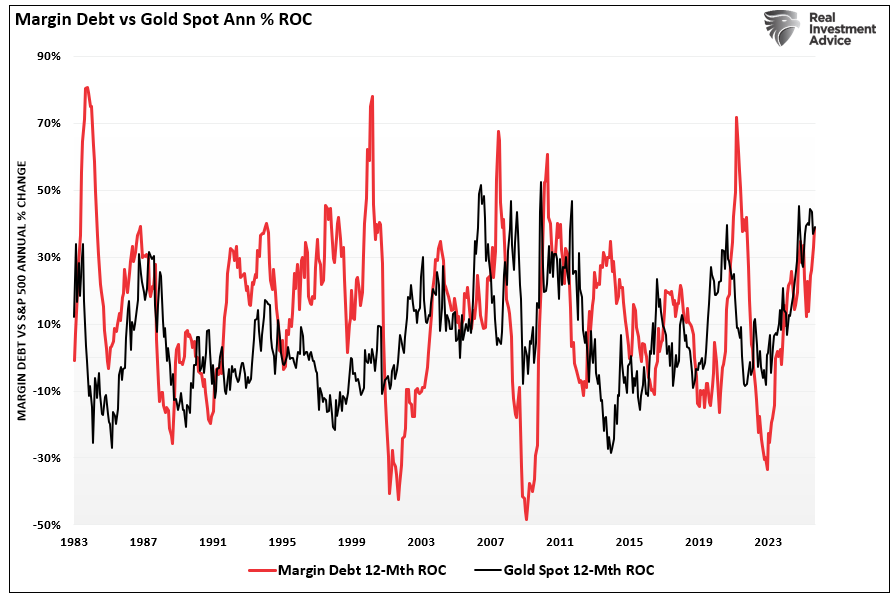
Re-read that last sentence from the BIS. For investors with invested capital, this matters deeply. While many are chasing gold and precious metals like silver higher, along with high-risk equities, leverage, and speculative trading activities, this is essentially a function of momentum chasing. This is illustrated in the chart below, which shows the annual rate of change in margin debt (leverage) alongside the annual rate of change in both equities and silver.
(Click on image to enlarge)

Yes, it remains the same for gold as well.
(Click on image to enlarge)
However, since most individuals do not understand the fundamental dynamics of “supply and demand” within traded assets, the media and promoters create “narratives” to support the price rise. Those narratives provide a comforting “calm” amid the “chaos,” but mask the risk that investors may unwittingly be taking on.
While there is nothing wrong with these “narratives,” or rather “justifications,” it is ultimately the “supply and demand” of buyers versus sellers that sets the prevailing price. With yields low and central banks maintaining loose monetary policies, assets such as equities and gold have continued to attract steady inflows, as leverage remains cheap and price momentum fuels asset speculation. However, that setup leaves little margin for error, and when something occurs to reverse leverage, the negative impact on correlated assets (such as equities, gold, and silver) occurs simultaneously.
Before dismissing this analysis out of hand, it is worth considering that when an institution like the BIS, known for its conservative, stability-focused analysis, raises the alarm, it deserves a modicum of your attention. This doesn’t mean you should go “sell everything and go to cash,” but the warning from the BIS is not theoretical, and should at least give you reason to think about the risk you are currently carrying. Such is particularly the case when the BIS noted that dual bubbles of this kind typically end with “a sharp and swift correction.”
Here is the risk to be watching. If both gold and equities unwind together, investors seeking safety have limited options. Such leaves Treasury bonds, cash, and very defensive positioning as traditional havens no longer deliver. As the BIS highlighted, the risk is that if central banks and reserve managers, many of whom have invested in gold, find themselves in unfamiliar territory where both markets fall simultaneously, the reversal of their positioning could be swift and uncoordinated.
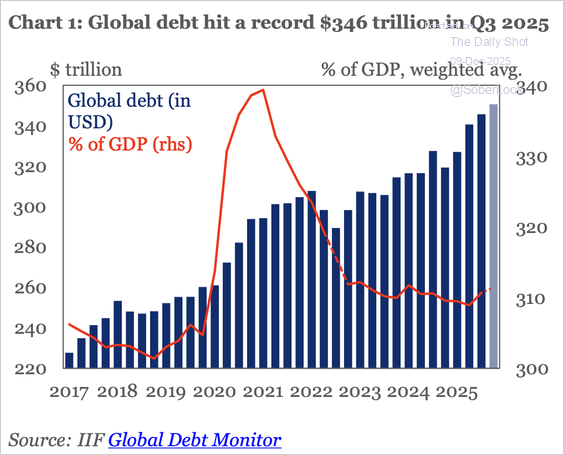
As is always the case, beneath the surface lies broader structural fragility. Debt levels worldwide remain elevated. Real interest rates, fiscal imbalances, geopolitical tensions, and unstable monetary policy combine to create a precarious macro environment. Those fears have been the driving force behind higher gold prices. However, when combined with speculative capital flows and retail-driven momentum in the equity markets, the risk of volatility increases.
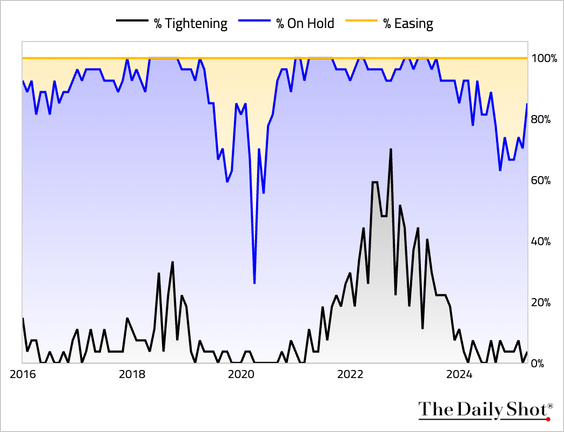
In fact, a largely unnoticed concern is that while global central banks were aggressively cutting rates over the last two years, they are now mostly all on hold.
This environment is a challenge to conventional diversification strategies. While the primary assumption is that gold provides a ballast when equities fall, it is not entirely unwise to question whether that assumption may no longer hold. In other words, when a “risk‑off” environment eventually manifests in the equity market, it may not necessarily translate to a rotation into gold.
That rethinking matters for anyone managing significant wealth or seeking capital preservation.
Navigating the “Double Bubble”.
Let me be very clear. I am not stating that, with absolute certainty, that a “mean-reverting” event is about to occur. Irrational markets can persist in this state for a prolonged period. However, as investors, we must consider the rising risk of a simultaneous correction in both gold and equities due to the current “Double Bubble.” This makes a measured and more flexible approach sensible.
Does this mean you should sell out of everything today? Absolutely, not. You should never “sell everything and go to cash,” as that tends to lead to even worse outcomes in the future. However, it does suggest that we consider taking small actions today that can protect us when the inevitable happens.
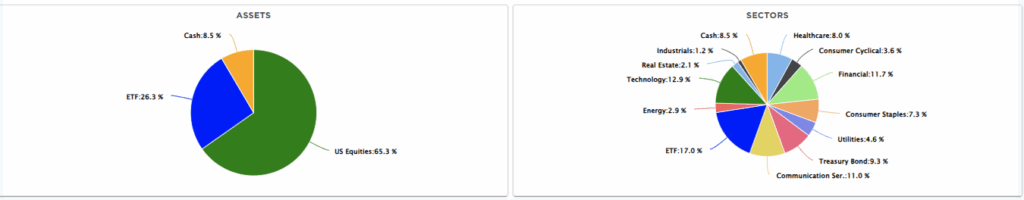
- Focus first on quality, stability, and liquidity. Begin by gradually adjusting your exposure to equities, focusing on companies with strong balance sheets, low leverage, consistent earnings, and pricing power. Defensive sectors, which have underperformed this year, such as consumer staples, industrial infrastructure, utilities, real estate, and essential services, may offer more resilience than high-beta, speculative growth names.
- Treat gold and precious metals as a hedge, not a core driver of growth. A moderate allocation to bullion, gold‑linked instruments, or commodities can offer a buffer. However, being aggressively overweight in precious metals increases risk if the “double bubble” bursts and gold behaves more like a speculative asset than a haven.
- Complement with inflation‑protected or flexible income assets. Inflation‑indexed bonds, short‑duration credit, high-quality municipal or sovereign debt, and cash equivalents provide ballast and optionality without undue sensitivity to high valuations or speculative excess.
- Maintain liquidity and readiness. Volatile markets can produce sharp drawdowns. Holding a portion of the portfolio in liquid, high-quality assets gives optionality. Such dry powder allows investors to redeploy into opportunities if markets reprice.
- Focus on diversification across uncorrelated asset classes. Combining income-producing equities, real estate, fixed income, and hedges, skewed toward downside protection, reduces dependence on any single trend or asset class.
- Monitor macroeconomic indicators closely. Track global debt levels, central bank behavior, currency movement (especially the US dollar), and interest rate trajectories. Evaluate changes in market sentiment, fund flows, and valuation metrics.
- Avoid momentum‑driven “herd” plays. Retail-driven inflows have helped fuel the dual rally. That kind of enthusiasm can reverse quickly if sentiment shifts. Therefore, resist chasing year-to-date outperformers purely on momentum.
- Prepare mentally and strategically for volatility. Accept that drawdowns may come. Use them to rebalance and reposition toward quality, safety, and value. Over time, that discipline often wins more than chasing every upside wave.
The BIS warning of the “Double Bubble” should not be dismissed as alarmist. It reflects structural shifts in how global reserves, investor behavior, and asset correlations are evolving. The simultaneous surge in gold and equities, that very “double bubble,” calls into question long-held assumptions about risk and refuge.
Investors who act now with clarity, balance, and discipline can be better positioned, whether markets continue to rise or correct sharply. Prudent investors will treat gold as a strategic hedge, not a speculative play, but most importantly, they will “understand the difference.” As an investor, you should always emphasize quality, liquidity, and diversification.
That approach gives you the chance to preserve capital, capture value, and survive in the long game.
Trade accordingly.
(Click on image to enlarge)
More By This Author:
Does AI Capex Spending Lead To Positive Outcomes?
A Third Of US Debt Matures In 2026
Hawkish Or Less Dovish? QE Or Not QE?


Comments
Log in or sign up to join the conversation.