
We received the following question from a client: “I was at a conference where they showed that roughly a third of the currently existing US Government debt is set to mature in the next few years. How can we pay it back?” A third of the approximately $30 trillion in US Treasury debt equates to $10 trillion in Treasury bonds maturing next year. Thus, whether measured as a percentage (a third of all debt) or by the notional amount ($10 trillion), the Treasury’s refunding task seems daunting. However, repaying a third of its debt load is not as challenging as some fearmongers lead the public to believe.
Currently, investors and the Federal Reserve own 100% of the $10 trillion of Treasury debt that will mature next year. Chiefly among these investors are money market funds, fixed-income investors, foreign countries, insurance companies, individuals, and corporations. These investors are either legally required to hold short-term Treasury notes, have an operational need for them, or prefer them. Thus, when their debt matures next year, almost all of those investors will need to reinvest the proceeds. Accordingly, the $10 trillion in Treasury notes maturing will be met with about $10 trillion worth of demand.
Make no mistake, the soaring Treasury debt levels are a problem. But what should matter to investors is how much new Treasury debt will be issued next year. Furthermore, government debt has a negative multiplier. In simple terms, each additional dollar of debt ultimately reduces economic activity. Thus, refunding a third of the debt, or even finding buyers for the new debt, is not a primary concern of ours. What concerns us more is the impact of runaway fiscal spending on tomorrow’s economy.

What To Watch Today
Earnings
- No earnings releases today
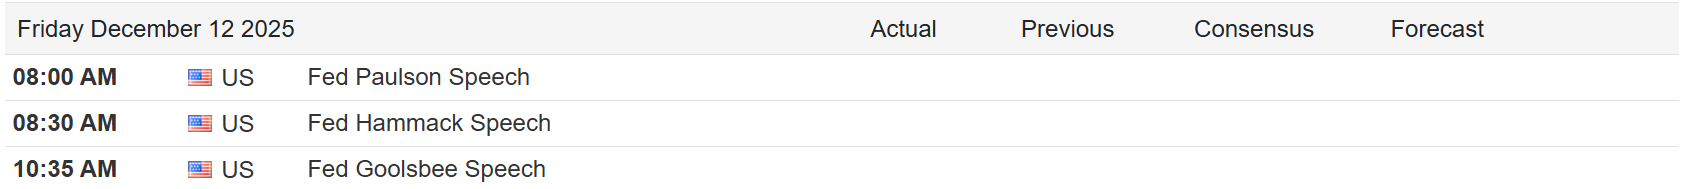
Economy
Market Trading Update
In yesterday’s note, we discussed the opportunities that may present themselves in 2026 in more defensive areas of the market. At the same time, we started making a few adjustments in our primary models by doing some tax loss harvesting and adding some of these more defensive holdings like MO, VZ, DIV, and AES.
As discussed yesterday, the significant outperformance of growth stocks over value is creating a potential opportunity, particularly when valuations are elevated. As shown, forward valuations (which are the most optimistic) are currently at levels where forward 5-year returns are expected to decline. By adding stocks with high dividends, we “get paid to wait” while adding a defensive hedge to our growth positions.
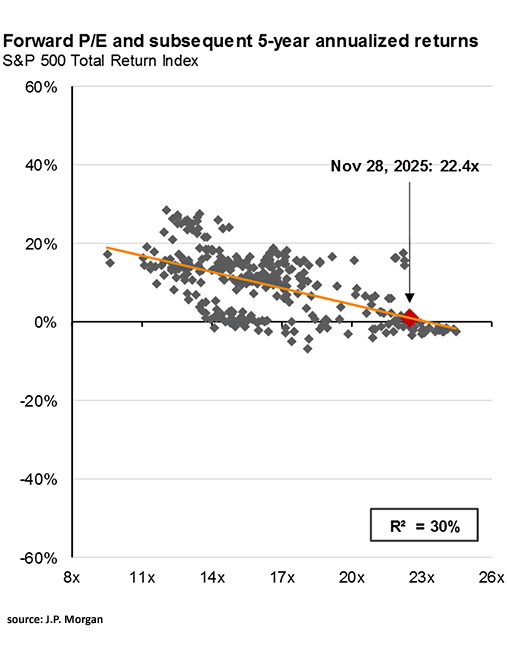
While there is no guarantee that 2026 will result in lower returns, given the massive outperformance to historical norms over the last 3-years, the risk is increasing. Such is why we are only adding small defensive positions currently and not making a “full shift.” Such actions give us a foothold to build into if, or when, the market begins to make a more serious rotation.
Just something to consider.
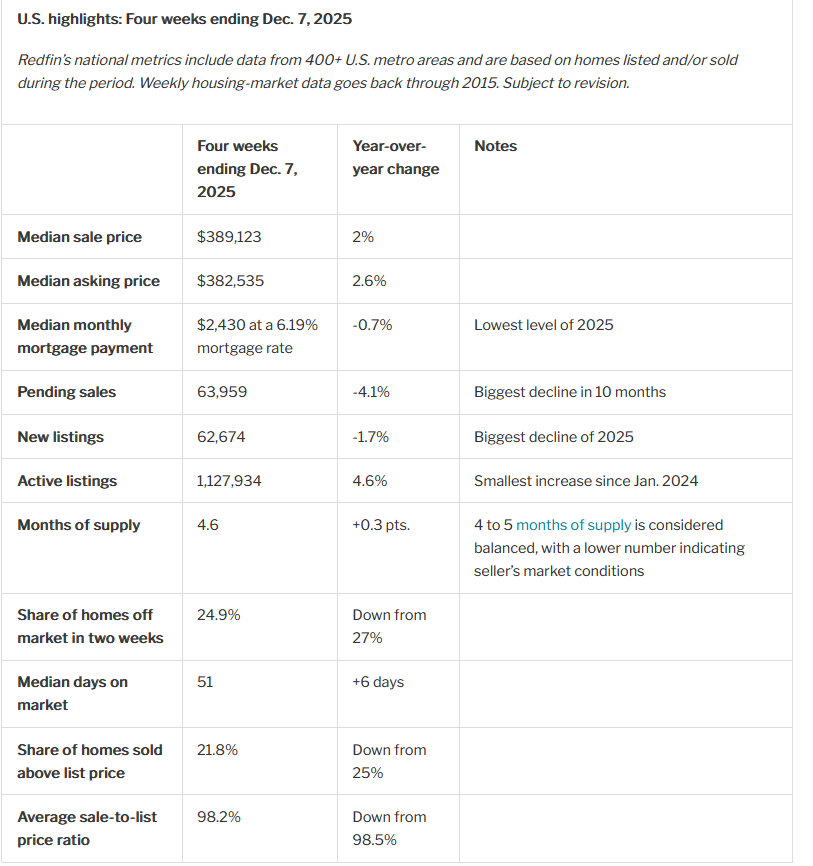
New Home Listing Drop By Most In Over 2 Years
On Thursday, Redfin reported that new home listings fell 1.7% year over year, the largest decline in more than two years. Sellers are holding back due to weak buyer demand and seasonal slowdown. Furthermore, many sellers are trapped with low mortgage rates. Redfin also reported that pending home sales fell 4.1% year over year and that homes are taking longer to sell, averaging 51 days. High prices and mortgage rates, along with economic uncertainty and tight inventory, are keeping buyers cautious.
The table below, courtesy of Redfin, presents additional data further indicating the housing market’s stagnation.
Sentiment vs Reality
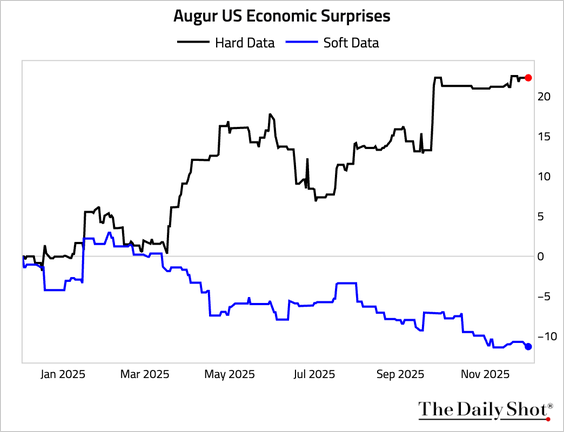
The graph below, courtesy of the Daily Shot, shows a disconnect between sentiment and actual economic activity. Hard data refers to actual economic data, such as retail sales, CPI, home sales, and unemployment claims. Soft data are the numerous consumer and business surveys that report on people’s feelings about the economy.
Since the tariffs sentiment has been weakening, while economic activity has generally expanded. For example, the Atlanta Fed’s GDP NOW forecast for the third quarter is near 4%. If realized, that would be the best growth rate since 2021. At the same time, the University of Michigan Consumer Sentiment survey is at its lowest level since the study began in 1960.
Such a disconnect is not likely to continue. Typically, when consumer sentiment or business sentiment is negative, consumers or business leaders cut back on spending and investment. Accordingly, economic activity tends to deteriorate. Looking ahead, either sentiment improves to match economic activity, or economic activity catches down to sentiment.
Tweet of the Day

More By This Author:
Hawkish Or Less Dovish? QE Or Not QE?
Hassett To Replace Powell: Betting Markets Are Confident
Is Japan In A Death Spiral?: A Contrarian Take


Comments
Log in or sign up to join the conversation.