

Image source: Pixabay
Market Brief – Fed Cuts Rates: Risk Management Or Mistake?
The Federal Reserve delivered its first rate cut of 2025 on Wednesday, lowering the target range for the federal funds rate by 25 basis points to 4.00%–4.25%. The move had been well-telegraphed, yet it still represents a notable pivot in policy focus. For much of the past two years, inflation had been the Fed’s primary concern, but this time the statement emphasized that “downside risks to employment have risen”, a shift toward the labor side of the mandate. This framing suggests the Fed is willing to risk cutting into still-sticky inflation to avoid potential damage to the job market.
Market reaction to the announcement was anything but straightforward. Immediately following the announcement, stocks whipsawed intraday before finishing mixed. Bond yields initially fell but closed firmer, with the 10-year Treasury settling near 4.07%, while the U.S. dollar strengthened modestly. But Thursday morning, stocks rebounded, supported by news that Nvidia (NVDA) would make a $5 billion investment into rival Intel (INTC) to produce AI and datacenter-related chips. However, one of the largest options expiration days on record impacted Friday. Early in the day, as options rolled, the market gave up all its early morning gains. However, mid-morning news from the White House that a deal was struck with China on TikTok sent markets rocketing back to their highs, with Apple leading the charge.
Still, the underlying question remains: is the Fed making a mistake by cutting now? On one hand, many analysts view the cut as a “risk management” maneuver designed to get slightly ahead of a potential labor market slowdown without committing to a complete easing cycle. Seema Shah, at Principal, argued the move helps “get ahead of a slowdown without overreacting,” while Gregory Faranello of AmeriVet described the strategy as a “methodical pathway down to neutral.” Brandywine’s Jack McIntyre summed up the Fed’s challenge by noting it “is in a tough spot…this was a risk-management cut.” Yet the risk is that cutting rates into an environment of still-elevated inflation, particularly if tariff-related costs eventually emerge, could push the Fed into a tough spot.
In effect, Powell’s Fed is threading a narrow needle. If the labor market weakens sharply in the months ahead, the Fed will look late rather than proactive. If growth stabilizes or re-accelerates, easing at this point could be seen as stoking “animal spirits” unnecessarily.
The market’s muted reaction in equities and a stronger dollar suggest that investors are not entirely convinced the Fed has struck the right balance.
Technical Backdrop
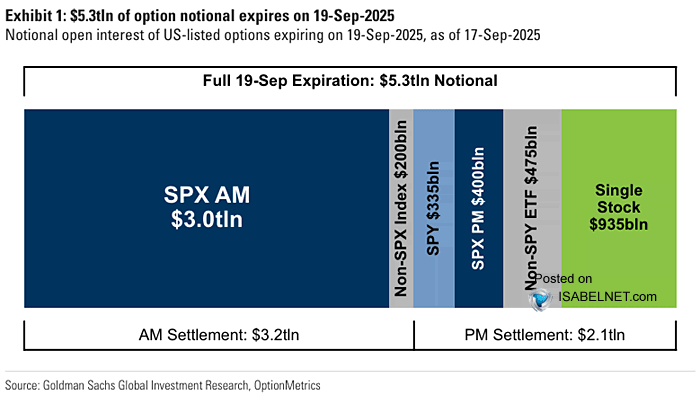
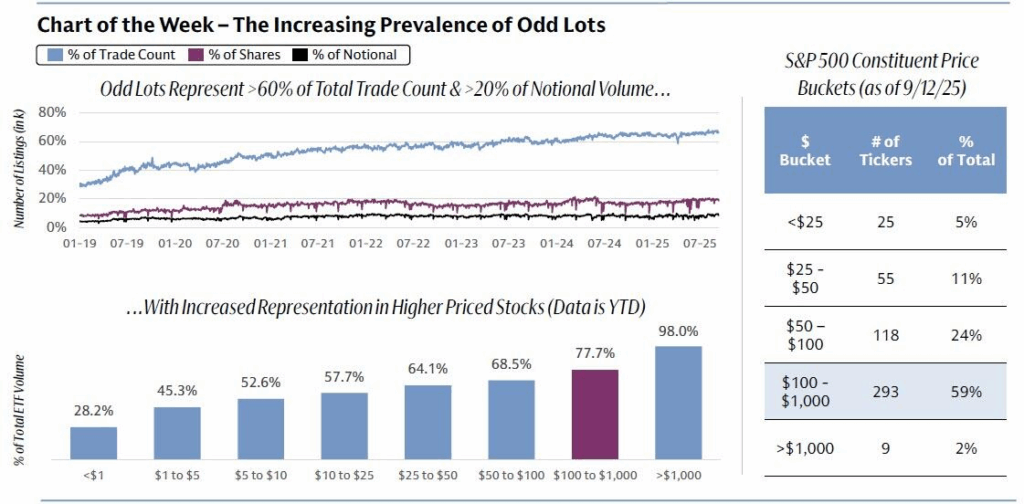
Technically, markets continue to set new all-time highs. The S&P 500 closed the week at 6652. The market continues to grind higher and is trading two standard deviations above its 50-DMA. Notably, the markets have continued to push higher, driven by the Mega Cap names, but small and mid-cap stocks have also continued to post stellar gains over the last two months. The signs of a FOMO chase are evident, particularly in heavily shorted names and retail favorites. As Goldman Sachs noted in its latest weekly report, odd lots, or transactions with fewer than 100 shares of stock and a proxy for retail trading, just hit 66% of all US equity trades in Q3. That is up from only 31% in January 2019, representing more than 20% of notional volume and 8% of total executed shares!
(Click on image to enlarge)
Volatility remains unusually low. The VIX is trading around 15.6, placing it in the bottom decile of recent history. Such a backdrop is consistent with “buy-the-dip” psychology but leaves little margin for error heading into a heavy options expiration. Dealer positioning could easily magnify swings if the market breaks its tight range.
(Click on image to enlarge)
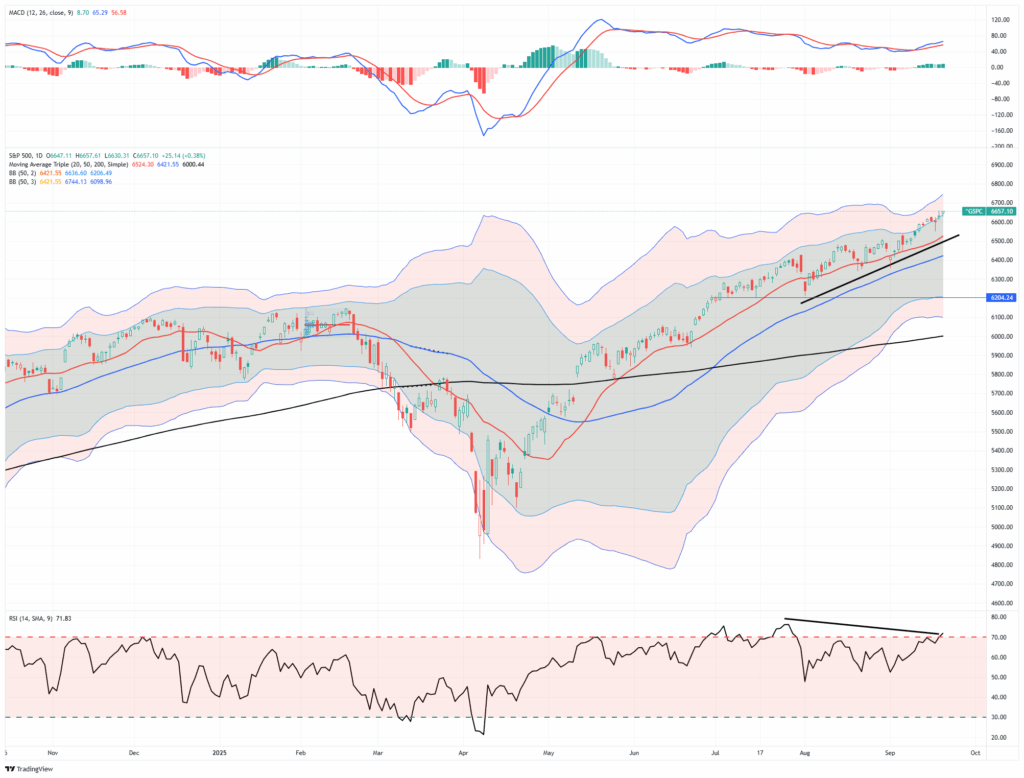
Breadth continues to be a key concern. While Wednesday’s action favored financials and cyclicals, mega-cap technology remains the dominant driver of the indices through week’s end. There were also several unusual dynamics worth highlighting. First, the negative divergence remains concerning. Historically, such divergences tend to precede short-term corrective periods. While such a correction has not occurred as of yet, it doesn’t mean that it won’t. Secondly, the deviation from the 50-dma is getting rather extreme, and also argues for at least a breather in the current advance. While none of this is bearish, it does suggest near-term risk management may be beneficial.
Support and Resistance Levels: The S&P 500’s near-term support lies at the 20-day moving average (~6,524). The 50-day moving average is roughly in the ~6,420 region but there is deeper support near ~6,200, connected with the previous pullback. Resistance is around the most recent highs in the 6,700 area (2- 3 standard deviations above the 50-DMA). Notably, volatility (as measured by VIX) remains relatively subdued. The 200-day moving average remains key support for a more significant correction. (~6000)
In short, the technical backdrop remains supportive of risk-taking. Still, with low volatility, sticky long yields, and fragile breadth, the setup argues for tighter risk management heading into next week’s data calendar.
Key Catalysts Next Week
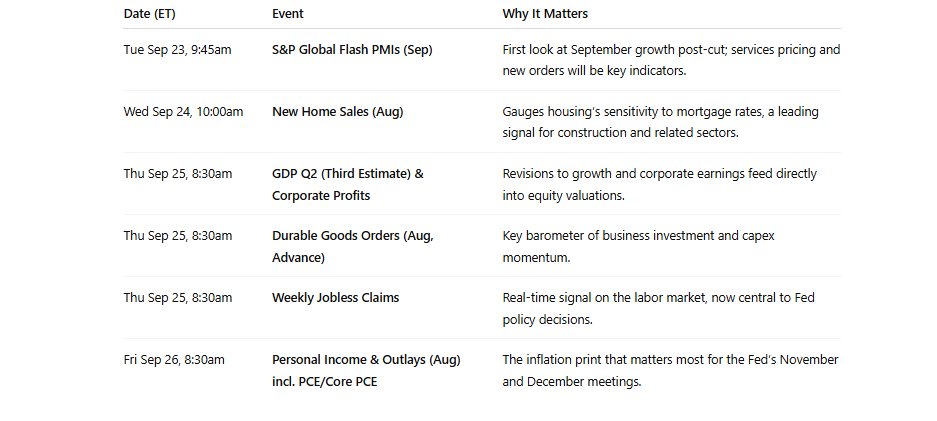
Next week, a data-heavy slate will be delivered that will likely determine whether the Fed’s risk-management cut is validated or questioned. Investors will get early snapshots of September activity through the S&P Global flash PMIs, fresh readings on housing and durable goods, and the third estimate of Q2 GDP, including revisions to corporate profits. The week ends with the release of August personal consumption expenditures (PCE), the Fed’s preferred inflation gauge. With Powell explicitly tying policy to labor market risks, these reports will be scrutinized for confirmation that the economy is slowing enough to warrant the cut, or whether inflationary pressures continue complicating the picture.
(Click on image to enlarge)
These data releases will be the first real-world test of whether the Fed’s pivot was well-timed. Stronger-than-expected activity or stubborn inflation would raise doubts about the wisdom of cutting now, while weaker labor and consumption data would justify the Fed’s emphasis on risk management. Either way, markets are entering a period where every data point has the potential to shift policy expectations sharply.
Need Help With Your Investing Strategy?
Are you looking for complete financial, insurance, and estate planning? Need a risk-managed portfolio management strategy to grow and protect your savings? Whatever your needs are, we are here to help.
Bull Market Run – How We Got Here
Markets have posted a powerful rally since the early April lows. That turning point marked a shift in sentiment, policy expectations, and risk appetite as the S&P 500 and Nasdaq reached record levels. The market surge has prompted investors to move aggressively into risk assets across the market spectrum. With sentiment elevated and concerns about risk non-existent, the fuel for the rally has come from three primary sources:
- Expectations of interest rate cuts,
- Easing geopolitical pressures, and;
- Continued speculation around artificial intelligence.
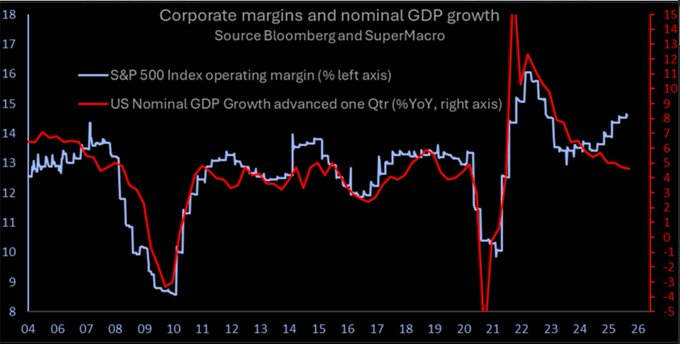
Simultaneously, as discussed last week, the April jobs report showed a softening in labor market conditions, leading economic indicators remain weak, and consumption signals are becoming increasingly more bearish. While this “bad news” gives the Federal Reserve cover to cut rates, that bad news will eventually be reflected in earnings and valuations. Furthermore, while inflation data has moderated, which fed into the narrative that rate hikes were over, the bond market responded by pricing multiple rate cuts over the coming quarters as economic growth slows. Investors cheer lower Fed rates since they reduce the discount rate on future cash flows, lifting valuations, particularly in growth and tech sectors. However, revenues are at risk of slowing with the economy. As I posted on “X” last week:
“The big risk to the current market environment is that while #margins have remained strong for the last couple of years, it is unlikely they can remain detached from underlying economic activity indefinitely. Cost cutting, layoffs, and productivity enhancements are limited in scope.”
Nonetheless, the narrative of monetary easing has become a cornerstone of the current bull market.
As such, the Artificial Intelligence (AI) trade has returned with full force, with Mega-cap tech stocks seeing strong inflows. Nvidia, Microsoft, and other leaders in the AI space, who posted strong Q2 results, continue to see expectations increase.
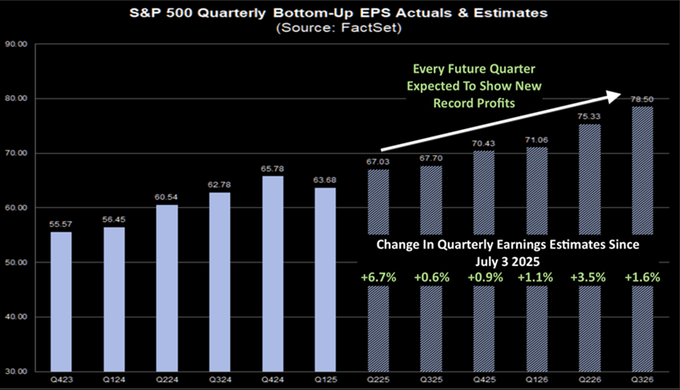
“Wall Street analysts have increased estimates for Q3 and Q4 2025 and Q1 and Q2 2026. As a result, analysts now expect the S&P to post record earnings every quarter over the next year.
According to Data Trek: ‘Positive S&P 500 earnings revisions are very uncommon unless the US economy is coming out of a recession, so the Street’s recent bullishness on future index earnings is nothing short of remarkable.‘”
It is important to note that those forward expectations of record profits are not uncommon. Wall Street analysts are always overly optimistic, and expectations seldom align with reality. However, these bullish drivers have also created imbalances and overbought conditions, as I noted in Wednesday’s DailyMarketCommentary:
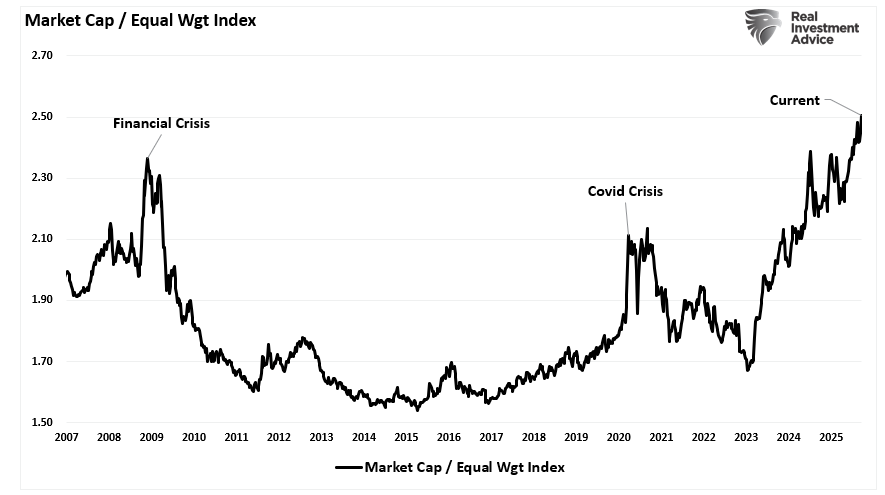
“The market is overbought and should not be surprising given the run since the late March and early April correction. However, as noted previously, that run has been predominantly concentrated in the largest market-capitalization names, as noted by the divergence between the equal-weighted and market-cap-weighted S&P 500 Index.”
(Click on image to enlarge)
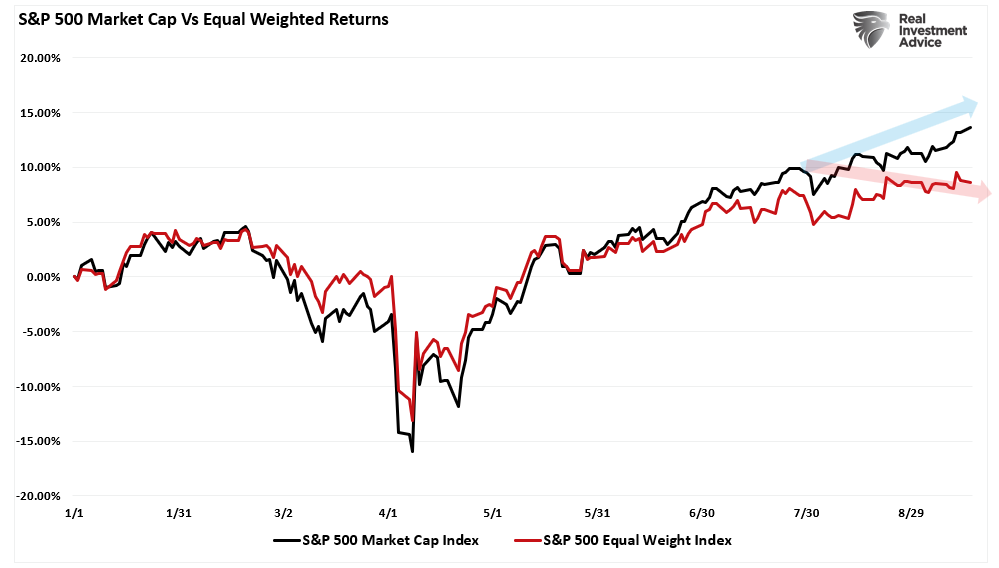
“The performance spread between the two indices can help us visualize the breadth differential in the market better. While the current performance differential is noteworthy, it does not mean the market is set for a significant bear market, but it does argue for some caution.”
(Click on image to enlarge)
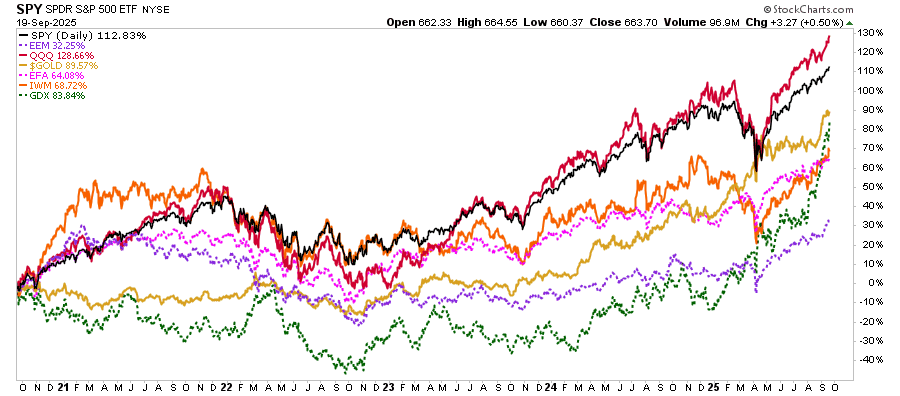
Most importantly, however, typically non-correlated assets have rallied together over the last five years. The Nasdaq is up 129%, and the S&P (SPY) is higher by 113%, followed by gold (90%), small caps (69%), gold miners (84%), international (64%), and emerging markets (32%). While it has been a good investing market for virtually any asset class you want to throw money at, it is now extremely overbought and leaves investors vulnerable to a correction that could simultaneously impact every asset class.
(Click on image to enlarge)
While the clear winner over the last five years has been to chase technology stocks or large-cap stocks in general, the build-up of complacency and deviations from long-term means is a risk worth considering. As noted, from a technical perspective, overbought conditions exist on multiple levels, from relative strength to momentum to deviations from long-term means. These technical warning signs often precede periods of consolidation or correction.
With investor sentiment nearing more exuberant levels, such extremes rarely last without a reset. The risk now is that the bullish narrative is fully priced in, and the room for upside surprises has narrowed, particularly in the AI trade itself.
The AI Trade — Strengths, Risks, and Overextension
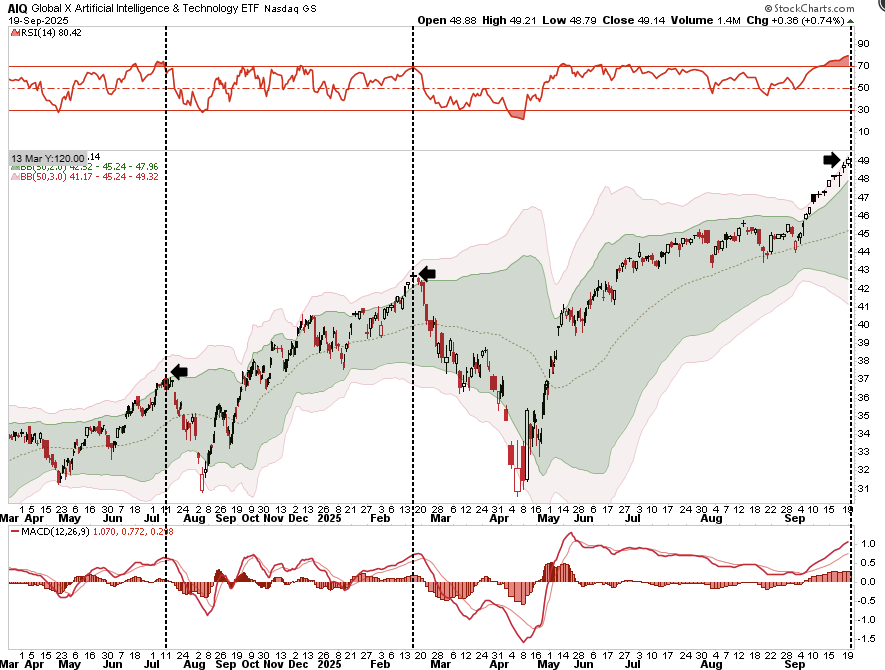
Artificial intelligence has captured Wall Street’s imagination. The investment thesis is clear: AI will reshape industries, generate new efficiencies, and create trillion-dollar opportunities. Companies with exposure to AI infrastructure, cloud computing, and data centers are the primary beneficiaries. Unsurprisingly, investors have responded by concentrating capital in a narrow group of stocks, driving valuations higher and fueling the current rally. The chart below shows the Global X Artificial Intelligence ETF (AIQ), sporting overbought conditions not seen since just before the April “Liberation Day” sell-off.
(Click on image to enlarge)
However, the AI story is not without merit. Revenue growth in cloud infrastructure, chip design, and data services continues. Oracle recently reported a strong demand for AI workloads, while Nvidia’s earnings have validated the explosive demand for computing power. Microsoft, Amazon, and Alphabet are building out AI capabilities at scale, and those developments should support the bullish thesis in the long term. However, markets rarely move in a straight line, and the risks are now building that expectations will likely be ahead of future realities.
That last sentence is the most important. AI space valuation is stretched, with extreme forward earnings multiples for related companies. Many of these companies are priced for perfection, and any slowdown due to economic weakness, overestimated demand, or margin compression could trigger a sharp repricing. With investor positioning crowded, from hedge funds and institutions to retail investors, everyone has increased exposure to the same names. That “crowding” creates fragility where an unwind could be swift if the narrative cracks.
Another aspect is widely overlooked. Policy risk is on the rise with potential AI regulation coming. Governments worldwide are moving to address ethical, privacy, and national security concerns tied to AI development. Increased scrutiny means rising compliance costs and potential restrictions on deployment. These regulatory headwinds are not yet priced in.
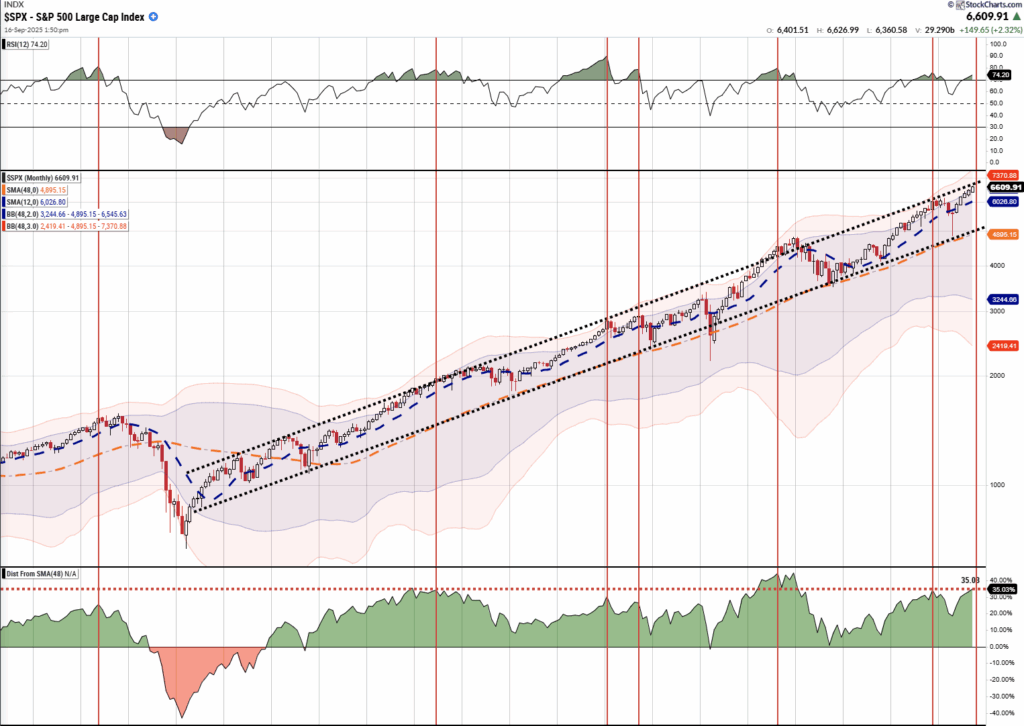
The AI trade is technically extended, and overbought conditions push extremes. For example, the Nasdaq is trading well above key moving averages, breadth within tech is narrow, and several key stocks show signs of exhaustion. In the S&P 500, the index is pushing the top of the long-term price trend channel, the deviation from the 4-year moving average is extreme, and relative strength is overbought on a monthly basis. Previous such conditions have not led to bullish outcomes.
(Click on image to enlarge)
The risk of a rotation or correction is high, and investors must distinguish between long-term structural trends and short-term speculative excess. Right now, both are in play. The challenge is managing exposure without chasing the last leg of a crowded trade.
Gold & Gold Miners Go Parabolic
As noted above, another warning sign of the speculative market chase is that gold and gold miners, not typically associated with speculative rallies, are in a speculative melt-up. Historically, gold is a hedge against market stress, inflation, or currency debasement. Yet this year, gold has rallied alongside equities, technology stocks, and bitcoin. That correlation is unusual and speaks to the broader theme of bullish exuberance. The chase for returns has spilled into every market corner, even in traditionally defensive assets that are now caught in the same speculative undertow.
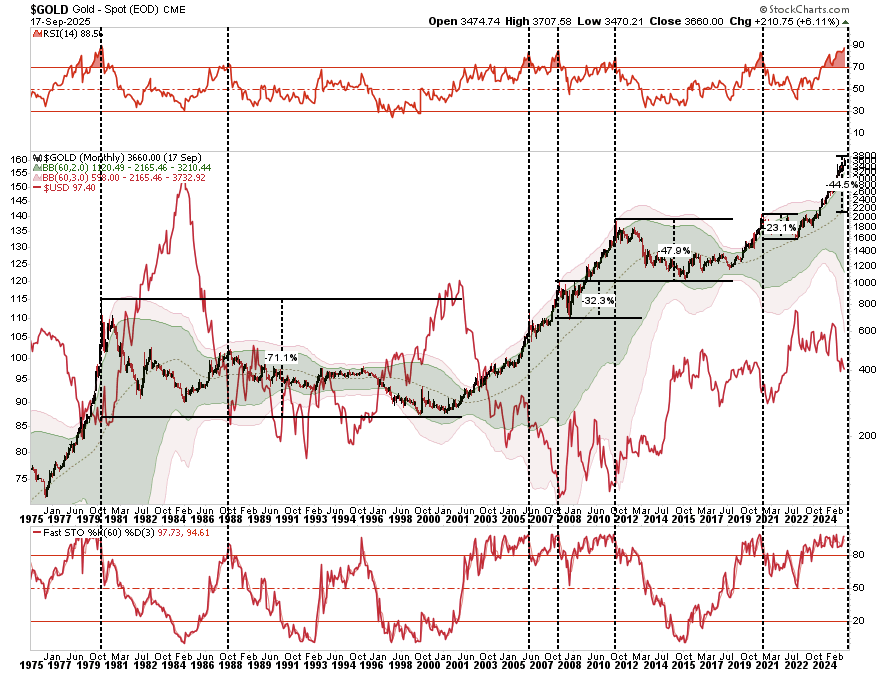
Gold has reached all-time highs, fueled by central bank demand, geopolitical uncertainty, and a softening dollar. Real yields have edged lower, and inflation expectations remain elevated. These factors support the gold narrative. A higher negative correlation exists between the US dollar and gold prices. This makes sense as when the dollar declines, foreign central banks holding U.S. dollars as reserves shift into gold, which trades in dollars, to offset the currency risk. That also works in reverse. Investors should pay close attention to the dollar as an eventual reversal will be key.
(Click on image to enlarge)
But the move in gold miners has been even more aggressive. The VanEck Gold Miners ETF (GDX), a proxy for gold miners, has surged nearly 100% off its lows. That’s not typical behavior for a sector known for volatility and operational risk. Previous moves that have elicited such extreme overbought conditions have historically been closer to a peak of the advance than not.
(Click on image to enlarge)
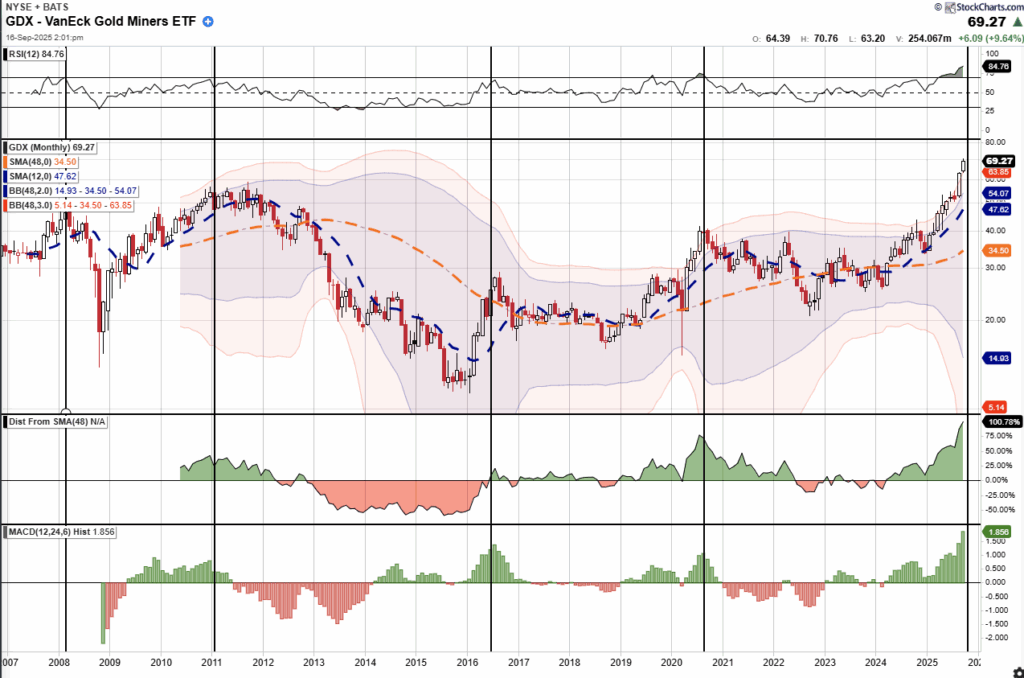
Miners benefit from rising gold prices, but their earnings are tied to cost structures, energy prices, and management execution. Many gold mining companies have underinvested for years, and while the recent rally has renewed investor interest, the cost structures for these businesses also increase with the price of gold. As noted, the technical indicators are flashing essential warning signals. Relative strength and momentum suggest extreme overbought conditions, and with many stocks trading at multi-year highs, and little regard for earnings variability, investors should consider their risk.
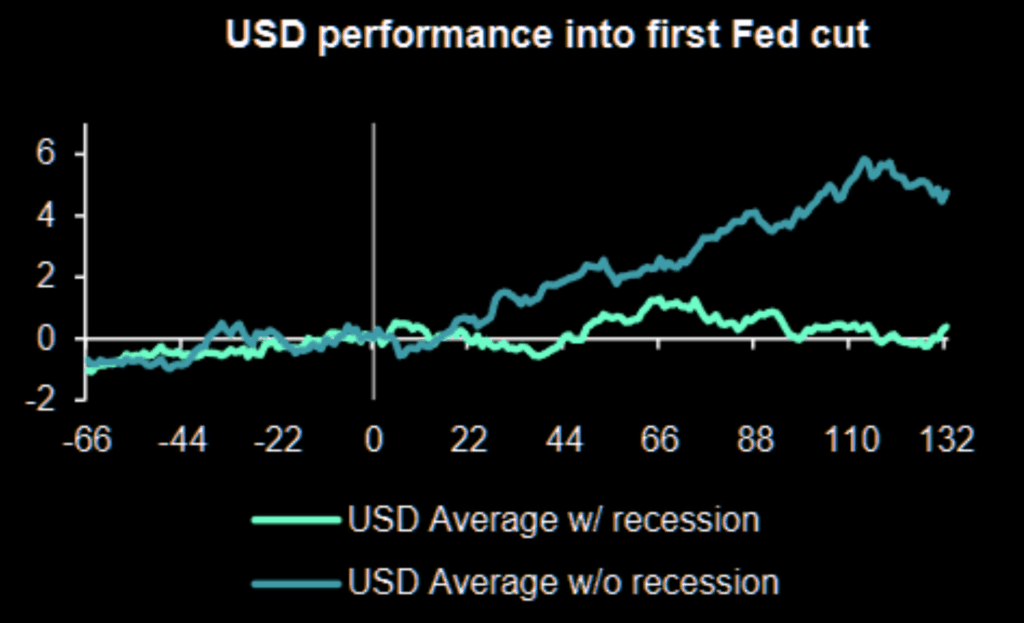
The broader concern is that gold and miners are now trading like momentum stocks. As noted, a dollar reversal could quickly undermine the bullish excitement, and with the dollar now trading at fair value, that risk is rising. Such is particularly the case given that the dollar historically rallies following a Federal Reserve rate-cutting cycle.
If risk appetite fades, these assets could sell off alongside stocks, leaving investors little exposure to traditional portfolio hedges. Investors should reassess how much downside protection these assets offer during a significant market correction and consider alternatives.
While the macro case for gold remains intact, the price action has likely run ahead of fundamentals. A pullback would help reset expectations.
Investors face the problem of chasing performance, which carries as much risk as chasing AI. The lesson is simple: when everything rallies together, something eventually breaks.
Portfolio Tactics – What Really Matters
When multiple asset classes rally simultaneously, it often reflects excess liquidity and investor optimism. That’s what we see today. Stocks, tech, gold, and miners are all overbought, with breadth weak, and positioning is crowded. Forward returns from current levels are likely to be lower. Investors must shift from offense to defense.
The risks are well-known. A misstep in Fed policy, inflation surprises, weak earnings, or regulatory actions could all trigger a correction. Historically, when markets become this extended, mean reversion follows, and therefore, the key is to adjust before the crowd does. Here are several tactics investors should consider now:
- Trim into strength: Take profits in positions that have run too far, too fast. Focus on names with stretched valuations or parabolic price action.
- Rotate into value and defensive sectors: Healthcare, utilities, consumer staples, and dividend-paying stocks offer more stability and less downside risk.
- Raise cash levels: Cash is not a drag in overbought markets. It provides flexibility. Use it to buy during corrections instead of chasing tops.
- Reduce concentration: Diversify exposure. Avoid heavy weighting in AI or gold-related sectors. Spread risk across multiple themes.
- Use hedges: Protective puts, collars, or volatility instruments can limit downside. These tools are cheap when volatility is low.
- Reassess your bond exposure: During a correction, bonds will likely restore their safe-haven status as risk assets unwind.
- Avoid FOMO: Don’t chase late-stage rallies. Discipline trumps emotion. The market will give you another entry point.
- Focus on fundamentals: Favor companies with strong balance sheets, consistent cash flow, and manageable debt. Avoid speculative names without earnings.
- Watch sentiment indicators: When bullish sentiment reaches extremes, it often signals a turning point. Stay data-driven, not narrative-driven.
The market may still have upside, but the risk-reward has shifted. Tactical positioning now will protect capital when the inevitable pullback arrives.
(Click on image to enlarge)

More By This Author:
Data Centers And The Power Grid: A Path To Debt Relief?
Market Mechanics Override Weakening Economic Data
The Fed Cuts Rates: What Comes Next?


Comments
Log in or sign up to join the conversation.