
Since the middle of July, UST 10-year yields have fallen from 4.50% to 4.00%. While the yield decline has been profitable for bondholders, it has also aided many other investors. Such a finding may seem counterintuitive, considering that lower yields are the result of a significant weakening in the labor market and a range of other economic indicators suggesting an economic slowdown. Slower economic growth hurts corporate earnings. Thus, the environment should not be favorable for stocks. However, at times, as we see today, the market is willing to overlook potential earnings weakness and let market mechanics take over. Let’s discuss some of those market mechanics.
- Collateral Is More Valuable – Trades on margin are most often collateralized with Treasury securities. As bond yields fall and bond prices rise, the collateral becomes worth more and can thus support a greater number of assets.
- Passive Rebalancing – Portfolios that run a balance of stocks and bonds rebalance on a semi-regular basis. When the value of the bonds rises, the portfolios may need to sell bonds and buy equities if they underperformed.
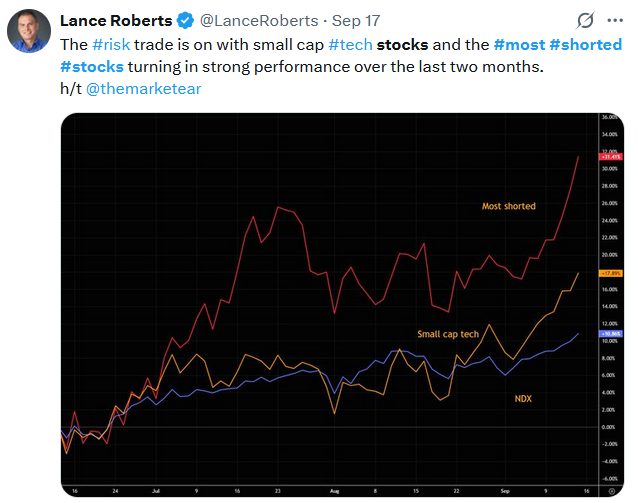
- Lower Margin Costs – A lower Fed Funds rate will result in a lower interest rate on margin loans. Accordingly, lower margin fees make buying assets more attractive. This helps explain why the most shorted stocks, whose trade economics are dependent on margin costs, are leading the rally, as shown in Lance’s tweet below.
In the longer run, we may find that the benefits of lower yields and the resulting market mechanics that support risk assets are insufficient to outweigh weakening economic conditions and earnings. However, in the short run, these market mechanics may help some risk assets look past the weakening economic outlook.
What To Watch Today
Earnings
- No notable releases today.
Economy
- No notable releases today.
Market Trading Update
In yesterday’s commentary, we discussed the overbought condition of multiple markets as the flood of money into all asset classes continues. Yesterday, the market continued to rally on the Fed cutting rates by 0.25%, but the primary driver was the advance in both Nvidia (NVDA) and Intel (INTC) surrounding a $5 billion investment in Intel for the development of AI and datacenter chips. Even though the market is trading at the top of its long-term trend and is pushing rather significant deviations from its long-term means, JP Morgan laid out the case as to why the market is likely to “explode” higher in October. To wit:
“Andrew Tyler said Wednesday’s move [by the Fed] delivered the ‘dovish cut that we were looking for,’ with the Fed mapping out two more to come this year. ‘These insurance cuts are supportive of the bull case, especially in light of [Tuesday’s] retail sales.’ Tyler and his team then raise the possibility of a data-driven push higher for stocks to come, focusing on two reports: September nonfarm payrolls, due Oct. 3, and consumer price inflation for that month, due Oct. 15.
If the jobs numbers bounce higher after two consecutive poor reports, and inflation ‘stays contained, look for equities to explode higher after what should be a strong [third-quarter 2025] earnings period. For those looking for 7K by year-end, this is the first part of the formula.’”
While stronger economic data could lift the market’s hope and keep the bullish run alive, the resurgence of stock buybacks, likely better-than-expected earnings results, and portfolio manager buying to “catch up” performance will prove a very bullish combination. As shown, the market has rallied back to the upper trend line after a test of the lower trend line. However, as we saw in 2021, an overshoot above that trend line is possible, and given the current bullish momentum and backdrop, that seems likely, putting 7000 as a reasonable target. If that occurs, the market will be extremely overbought on relative strength and deviation extremes that preceded previous market corrections.
(Click on image to enlarge)

Channeling my best Yoda, “The force is strong with this bull market, it is.” But as discussed yesterday, the extreme extensions are occurring across multiple asset classes simultaneously, posing investor risk in the future.
Enjoy the ride, but don’t forget to manage the risk. A correction is coming; only the timing is difficult to predict.
The Jobless Claims Rollercoaster
The weekly jobless claims data is the most real-time gauge of the labor market. While it can be extremely helpful to assess trends, we must be careful not to read too much into each data point. For instance, last week the number of initial jobless claims was 265k, up from 236k the prior week. That surprise jump made the number the highest since early 2022. The data was concerning, but yesterday we learned that this week’s initial jobless claims were back to 231k, in line with recent levels. There are two predominant reasons for the spike two weeks ago. First, the week included the Labor Day weekend. Holidays often result in more volatile economic data, including jobless claims. Second, there were a large number of fraudulent attempts to collect jobless claims in Texas. Per Axios:
Minutes after the report, economists flagged that the overall spike in weekly claims was a result of an unusual surge in Texas — a quirk some attributed to holiday effects or the state’s flood disaster claims program. But now the state’s labor office, which reports the data to the national Labor Department, said it was a direct result of fraudulent attempts to collect unemployment benefits.
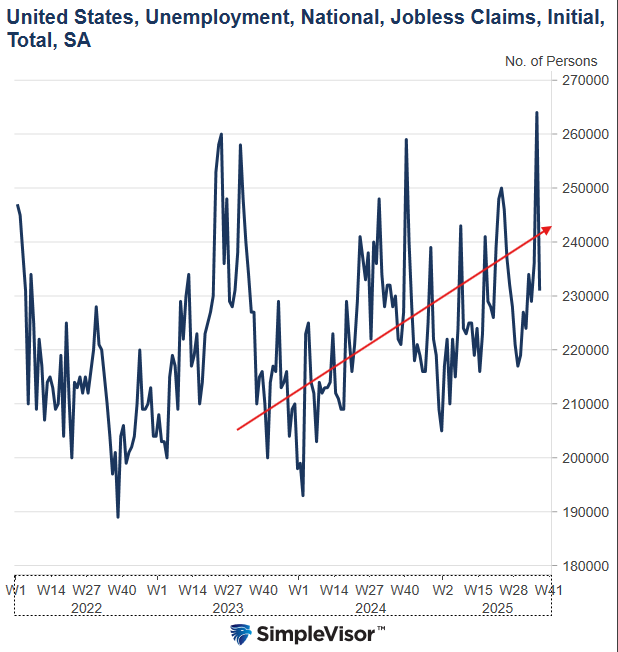
The graph below shows the volatile nature of the weekly jobless claims data. To reiterate, the trend, not the individual weekly data points, is what matters most. As the graph indicates, the trend has remained upward over the last two years.
SimpleVisor Portfolios
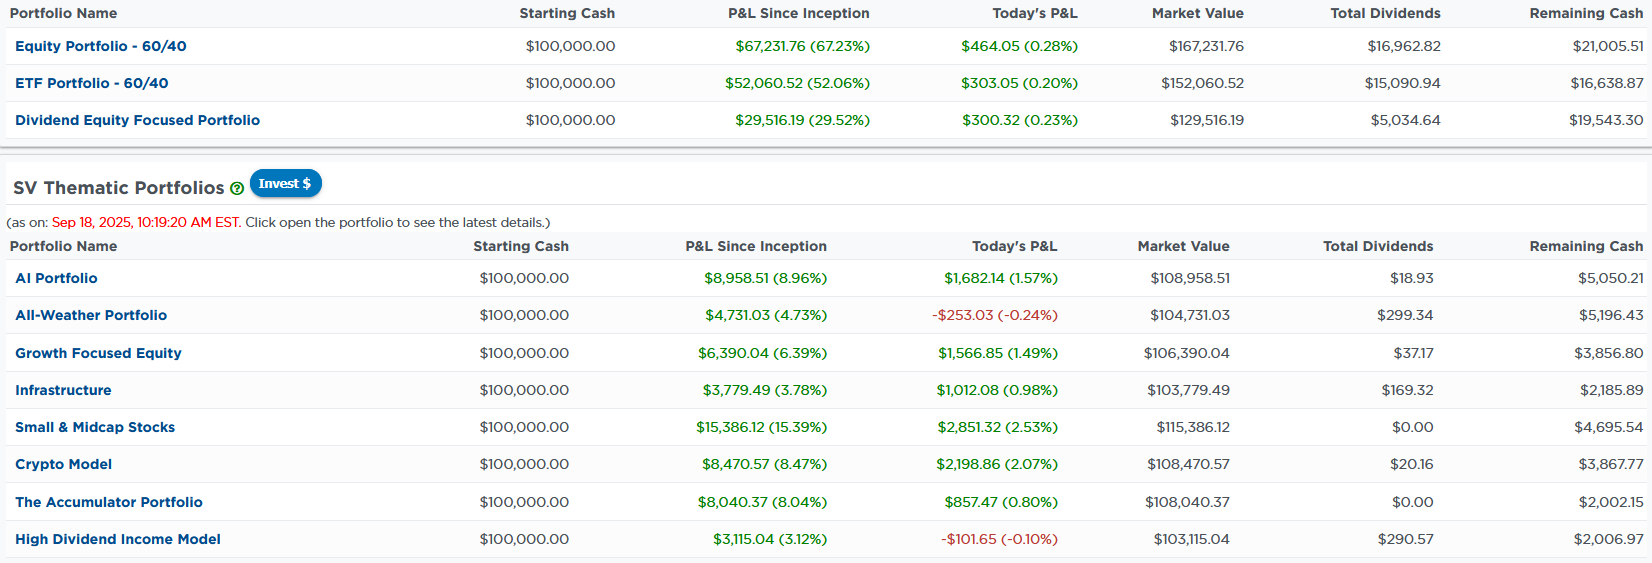
On August 1st, we introduced eight new thematic portfolios available for viewing on SimpleVisor and for investment in our new SimpleVisor investment platform. In addition to potentially serving as an investment option for some, they provide a window into the market for SimpleVisor subscribers. For example, the screenshot below shows our core three portfolios followed by the eight thematic portfolios. At the time we took the screenshot, our High Dividend Income and All-Weather portfolios were down. Both of these models are conservative and have good exposure to fixed-income assets, which were trading poorly at the time. Alternatively, highly speculative Small & Midcap Stocks and the Crypto Model were leading the way. Further market insight can be gained by looking at the holdings within each portfolio.
For example, as shown in the second screenshot below, approximately two-thirds of the stocks in the small and mid-cap model are up over 2%. At the time, the S&P 500 was up .60%. Thus, only four of the 20 stocks in that model were underperforming the market. Conversely, only two of the 21 stocks in the conservative All-Weather model were beating the market. These two models highlight that the rally yesterday, when we took these snapshots, was heavily a “risk on” speculative rally.
(Click on image to enlarge)
(Click on image to enlarge)

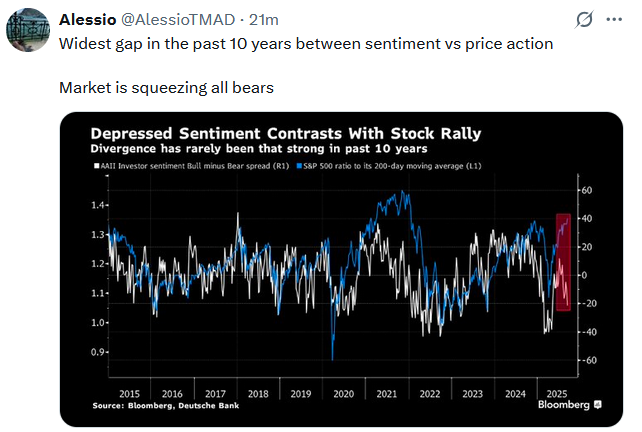
Tweet of the Day
More By This Author:
The Fed Cuts Rates: What Comes Next?Semiannual Reporting Requirements Are Overhyped
Trump’s BLS Reform Faces Steep Obstacles


Comments
Log in or sign up to join the conversation.